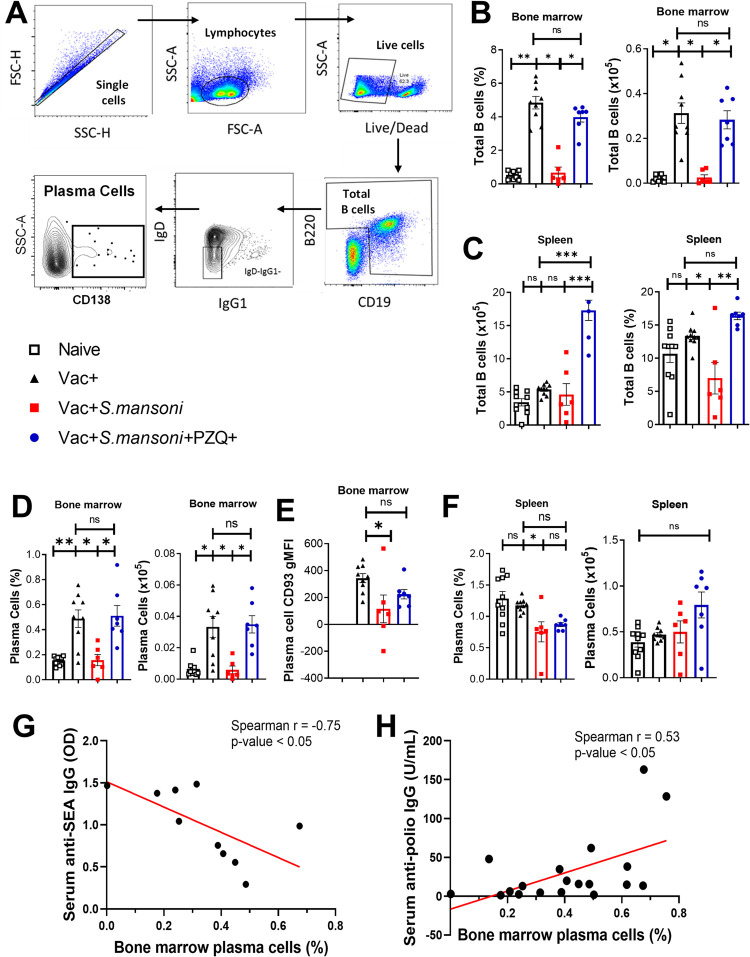
Fig 3. Total B cell and plasma B cell frequencies and counts at 18 weeks post schistosomiasis infection in the bone marrow and spleens of anti-Poliovirus vaccinated mice.
(A) Representative gating strategy for plasma B cells. (B) Bone marrow total B cell frequencies and total numbers. (C) Spleen B cell frequencies and total numbers. (D) Bone marrow plasma B cells. (E) CD93 gMFI of bone marrow plasma B cells. (F) Spleen plasma B cells. Data are expressed as mean ± S.E.M and representative of 2 independent experiments (n = 6–10 mice per group in each experiment); Data was analysed by the Shapiro-Wilk test followed by either one way ANOVA with Bonferroni’s multiple comparisons test or by Kruskal Wallis followed by the Dunn’s multiple comparisons test; ns, p> 0.05; * p< 0.05, ** p< 0.001, *** p< 0.0001; Vac, hexavalent (DTPa-hepB-IPV-Hib) vaccine; Sm, S. mansoni; PZQ, praziquantel; CD93, cluster of differentiation 93. Increasing serum anti-SEA IgG titres are associated with reduced bone marrow plasma cell frequencies while increasing anti-polio IgG titres are associated with increasing bone marrow plasma cells. G. Anti-SEA titres vs bone marrow plasma cell frequencies of schistosomiasis infected Vac+Sm+ and Vac+Sm+PZQ+ mice at week 18 p.i. H. Anti-polio IgG titres vs bone marrow plasma cell frequencies of Vac+, Vac+Sm+, and Vac+Sm+PZQ+ mice combined. G-H: Data are representative of 2 independent experiments (n = 4–10 mice per group); Data was analysed by Spearman’s correlation.

