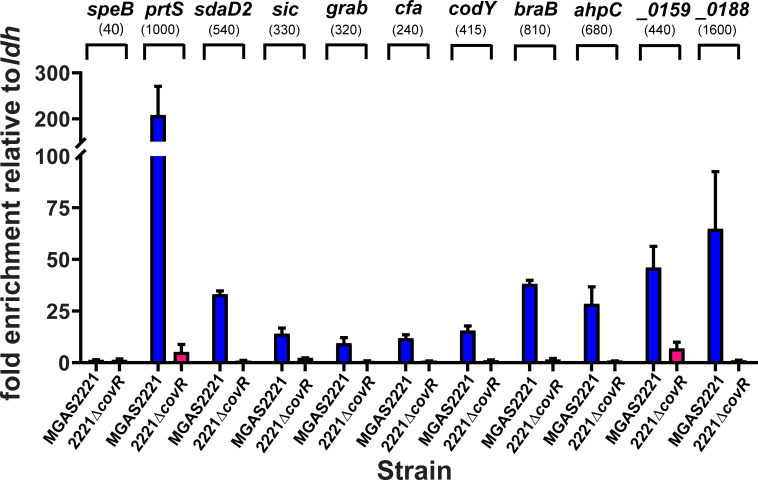
Fig 4. Validation of ChIP-seq binding data using SYBR qPCR.
Graph depicts normalized enrichment of selected promoter DNA (labeled on top of graph) in ChIP samples obtained from denoted GAS strains as measured by SYBR qPCR. Measurements were done in duplicate with at least two biological replicates grown to mid-exponential phase with data shown being mean ± standard deviation. Given the lack of peaks in our ChIP-seq datasets in the speB region, SYBR primers for the speB promoter were chosen based on [14]. The numbers in brackets indicate the average RPKL in ChIP-seq experiment for comparison.

