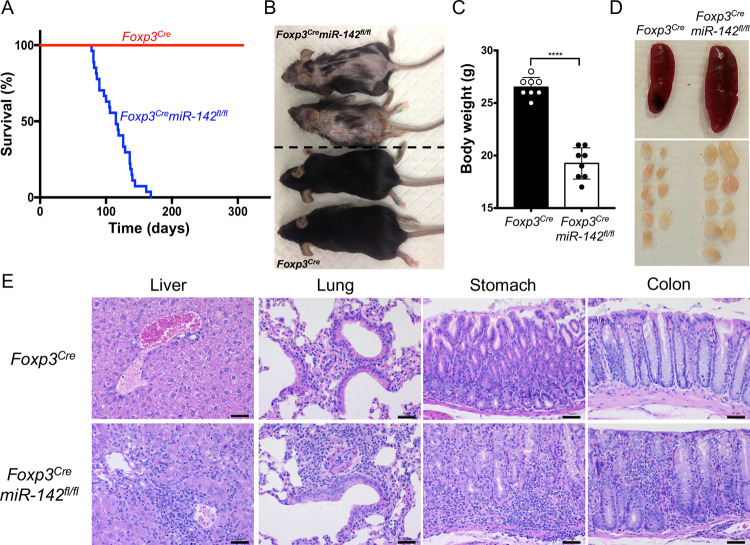
Fig 1. Fatal autoimmune disorder in mice with Treg cell–specific disruption of miR-142.
(A) Kaplan–Meier survival curves of Foxp3Cre and Foxp3CremiR-142fl/fl mice (n = 27 per group) (P < 0.0001). (B) Photograph of 14-week-old female Foxp3Cre (lower 2) and Foxp3CremiR-142fl/fl (upper 2) mice. Note smaller body size and severe dermatitis in Foxp3CremiR-142fl/fl mice. (C) Body weight comparison of 8- to 10-week-old male Foxp3Cre and Foxp3CremiR-142fl/fl mice (n = 8 per group). (D) Representative images of spleen and peripheral lymph nodes from Foxp3Cre (left) and Foxp3CremiR-142fl/fl (right) mice. (E) HE staining of liver, lung, stomach, and colon tissue sections from Foxp3Cre and Foxp3CremiR-142fl/fl mice. Note massive accumulation of leukocytes in Foxp3CremiR-142fl/fl tissues. Scale bar, 50 μm. Results are shown as mean ± SD. P values were determined by log-rank test (A) or 2-tailed Student t test (C); ****, P < 0.0001. The underlying raw data can be found in S1 Data file. HE, hematoxylin–eosin; SD, standard deviation; Treg, regulatory T.

