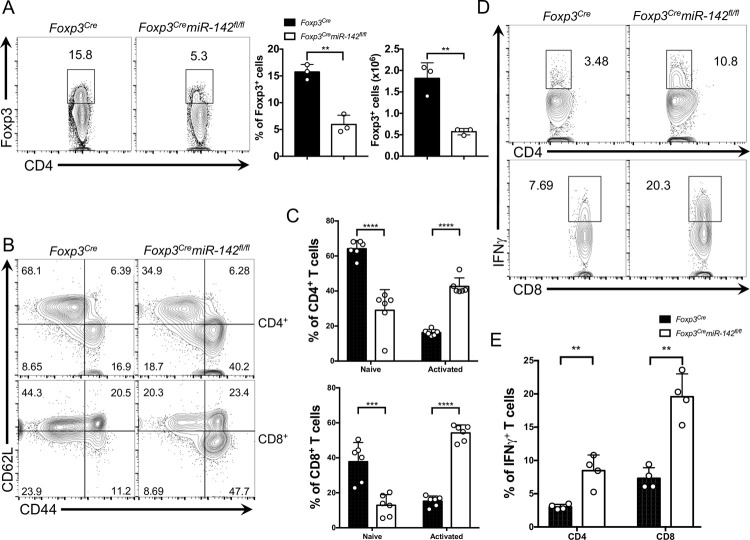
Fig 2. miR-142 is required for maintenance of Treg cell–mediated immune tolerance.
(A) Left panel, FACS analysis of splenic lymphocytes from 12-week-old Foxp3Cre and Foxp3CremiR-142fl/fl mice with anti-CD4 and anti-Foxp3 specific antibodies. Numbers indicate percentage of CD4+Foxp3+ Treg cells in the gate. Right panel, frequency and absolute number of Treg cells in Foxp3Cre and Foxp3CremiR-142fl/fl spleens (n = 3 per group). (B) FACS analysis of splenic CD4+ and CD8+ T cells from 8- to 10-week-old Foxp3Cre and Foxp3CremiR-142fl/fl mice with anti-CD44 and anti-CD62L specific antibodies. Numbers indicate percentage of cells in the quadrants. (C) Frequency of naive (CD44−CD62L+) and activated (CD44+CD62L−) splenic CD4+ (top) and CD8+ (bottom) T lymphocytes isolated from 8- to 10-week-old Foxp3Cre and Foxp3CremiR-142fl/fl mice (n = 6 per group). (D) Intracellular FACS analysis of IFNγ production in splenic CD4+ (top) and CD8+ (bottom) T cells. Numbers indicate percentage of IFNγ+ T cells in the gate. (E) Frequency of IFNγ expressing splenic CD4+ and CD8+ T cells isolated from 8- to 10-week-old Foxp3Cre and Foxp3CremiR-142fl/fl mice (n = 4 per group). Results are shown as mean ± SD. P values were calculated using 2-tailed Student t test. **, P < 0.01; ***, P < 0.001; ****, P < 0.0001. The underlying numerical raw data can be found in S1 Data file. The underlying flow cytometry raw data can be found at the Figshare repository. FACS, fluorescence activated cell sorting; IFNγ, interferon gamma; SD, standard deviation; Treg, regulatory T.

