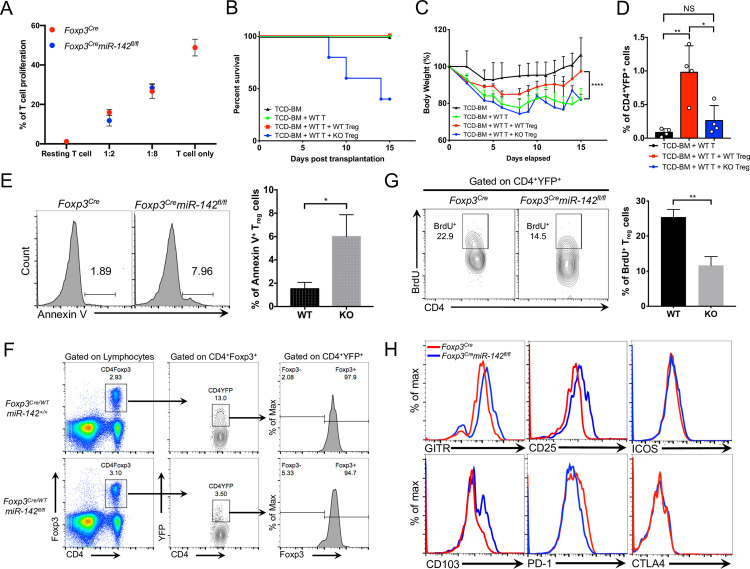
Fig 3. miR-142 ablation impairs suppressive function and homeostasis of Treg cells.
(A) in vitro Treg suppression assay. Purified CD4+ Tconv cells were loaded with CTV dye and incubated with FACS-sorted Treg cells from Foxp3Cre (red dots) and Foxp3CremiR-142fl/fl (blue dots) spleens (n = 3) in the presence of beads coated with anti-CD3 and anti-CD28 specific antibodies. After 3 days, the rate of Tconv cell proliferation was determined by flow cytometry as dilution of the CTV dye. Several Treg to Tconv cell ratios were analyzed as indicated in the graph. Unstimulated Tconv cells were used as control. (B) Survival of mice in aGVHD model. Lethally irradiated BALB/c recipient mice were transplanted with T-cell–depleted bone marrow from C57BL/6J mice (TCD-BM), Thy1.2+CD4+ T cells from C57BL/6J spleens (WT T), and CD4+YFP+ Treg cells derived from either Foxp3Cre (WT) or Foxp3CremiR-142fl/fl (KO) spleens (P = 0.0096; n = 5 per group). (C) Body weight analysis of mice in aGVHD model. Mouse grouping as in B (n = 5 per group). (D) Frequency of donor Foxp3Cre (WT) or Foxp3CremiR-142fl/fl (KO) CD4+YFP+ Treg cells in spleens of BALB/c recipient mice on day 17 after BMT (n = 4 for all groups). (E) Left panel, FACS analysis of activation-induced cell death in splenic Foxp3Cre and Foxp3CremiR-142fl/fl Treg cells. Apoptotic Treg cells were detected by Annexin V staining upon stimulation with anti-CD3 (1 μg/ml) specific antibodies for 48 hours. Numbers indicate percentage of Annexin V+ cells. Right panel, the frequency of Annexin V+ Foxp3Cre (WT) and Foxp3CremiR-142fl/fl (KO) Treg cells (n = 3 per group). (F) FACS analysis of CD4+Foxp3+ Treg cells (left panels), YFP-Cre expression in CD4+Foxp3+ Treg cells (middle panels), and Foxp3 expression in CD4+YFP+ miR-142–sufficient and miR-142–deficient Treg cells (right panels) from female Foxp3Cre/WTmiR-142+/+ and Foxp3Cre/WTmiR-142fl/fl mice. (G) Left panel, intracellular FACS analysis of BrdU incorporation into Treg cells isolated from Foxp3Cre and Foxp3CremiR-142fl/fl spleens. FACS plots were pregated on CD4+YFP+ Treg cells, and numbers indicate percentage of cells in the gate. Right panel, the frequency of BrdU+ Treg cells in Foxp3Cre (WT) and Foxp3CremiR-142fl/fl (KO) spleens 16 hours after BrdU injection (1mg i.p.) (n = 3 per group). (H) FACS analysis of cell surface markers on Treg cells isolated from Foxp3Cre (red) and Foxp3CremiR-142fl/fl (blue) spleens with anti-GITR, anti-CD25, anti-CD103, anti-PD-1, anti-CTLA-4, and anti-ICOS specific antibodies. Histograms were pregated on CD4+YFP+ Treg cells. Results are shown as mean ± SD. P values were calculated using log-rank test (B), 1-way ANOVA (C), and 2-tailed Student t test (D, E, G). *, P < 0.05; **, P < 0.01; ****, P < 0.0001; NS, not significant. The underlying numerical raw data can be found in S1 Data file. The underlying flow cytometry raw data can be found at the Figshare repository. aGVHD, acute graft-versus-host disease; BMT, bone marrow transplantation; CTV, cell trace violet; FACS, fluorescence activated cell sorting; KO, knockout; SD, standard deviation; Treg, regulatory T; YFP, yellow fluorescent protein; WT, wild-type.

