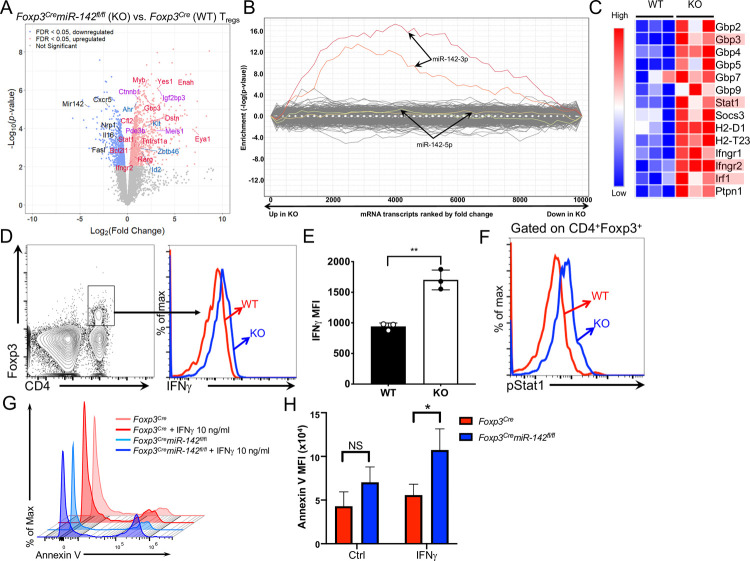
Fig 4. Global derepression of miR-142-3p targets and dysregulated IFNγ signaling in miR-142–deficient Treg cells.
(A) Volcano plot showing statistical significance versus magnitude of change for visualizing the distribution of differentially expressed genes. Selected miR-142 targets (red for -3p, blue for -5p, and purple for both) and other genes of functional interest (black; including miR-142) are labeled. (B) Global derepression of miR-142-3p target genes in miR-142–deficient Treg cells. SylArray analysis of 3′ UTRs of differentially expressed transcripts in miR-142–deficient Treg cells for miRNA SCSs. Enrichment P values for each miRNA SCS are plotted on the y-axis against the ranked gene list on the x-axis (the most up-regulated genes in miR-142–deficient Treg cells are toward the left, while the most down-regulated genes are toward the right). Plots corresponding to two 7-mer seeds of miR-142-3p are highlighted in red and orange, and two 7-mer seeds of miR-142-5p are depicted in green and yellow. (C) Heat map of expression profiles of IFNγ-associated genes in Foxp3Cre (WT) and Foxp3CremiR-142fl/fl (KO) Treg cells (n = 3 per group). Genes highlighted in red are putative targets of miR-142-3p. (D–F) Intracellular FACS analysis of IFNγ production (D) and Stat1(Y701) phosphorylation (F) in Foxp3Cre (red line) and Foxp3CremiR-142fl/fl (blue line) CD4+Foxp3+ Treg cells. (E) MFI of IFNγ expression in Foxp3Cre (WT) and Foxp3CremiR-142fl/fl (KO) Treg cells (n = 3 per group). (G) FACS analysis of Annexin V-stained splenic CD4+YFP+ Treg cells from Foxp3Cre (WT) or Foxp3CremiR-142fl/fl (KO) mice. Splenocytes were incubated for 24 hours in cell culture in the presence or absence of IFNγ (10 ng/ml) prior to flow cytometry analysis. (H) MFI of Annexin V staining on Treg cells from Foxp3Cre (WT) or Foxp3CremiR-142fl/fl (KO) spleens with or without IFNγ treatment (10 ng/ml). Results are shown as mean ± SD. P values were calculated using 2-tailed Student t test. *, P < 0.05; **, P < 0.01; NS, not significant. The underlying numerical raw data can be found in S1 Table and S1 Data file. The underlying flow cytometry raw data can be found at the Figshare repository. FACS, fluorescence activated cell sorting; IFNγ, interferon gamma; KO, knockout; MFI, mean fluorescence intensity; SCS, seed complementary sequence; SD, standard deviation; Treg, regulatory T; WT, wild-type.

