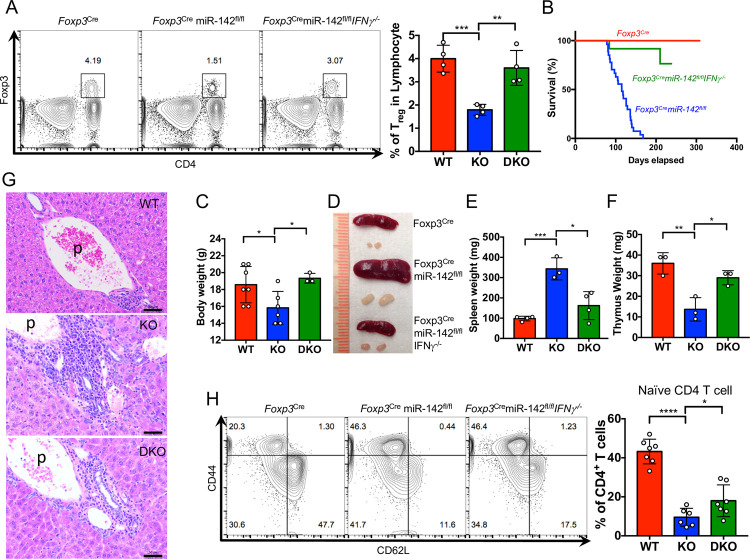
Fig 5. Blockade of IFNγ production rescues the Treg cell homeostatic defect and alleviates systemic autoimmunity in Foxp3CremiR-142fl/fl mice.
(A) Left panel, FACS analysis of splenic Treg cells from 12- to 15-week-old Foxp3Cre (WT), Foxp3CremiR-142fl/fl (KO), and Foxp3CremiR-142fl/flIfng−/− (DKO) mice (n = 4 per group). Foxp3+CD4+ Treg cells are gated and numbers indicate the percentage of cells in the gate. Right panel, frequency of CD4+Foxp3+ Treg cells in Foxp3Cre (WT), Foxp3CremiR-142fl/fl (KO), and Foxp3CremiR-142fl/flIfng−/− (DKO) spleens. (B) Kaplan–Meier survival curves for Foxp3Cre (red line; n = 27), Foxp3CremiR-142fl/fl (blue line; n = 27), and Foxp3CremiR-142fl/flIfng−/− (green line; n = 12) mice. (C) Body weight comparison of 7- to 9-week-old female Foxp3Cre (WT, red bar, n = 7), Foxp3CremiR-142fl/fl (KO, blue bar, n = 6), and Foxp3CremiR-142fl/flIfng−/− (DKO, green bar, n = 3) mice. (D) Representative images of spleen and inguinal lymph nodes from 14-week-old Foxp3Cre, Foxp3CremiR-142fl/fl, and Foxp3CremiR-142fl/flIfng−/− mice. (E) Spleen weights in 12- to 15-week-old Foxp3Cre (WT, red bar, n = 4), Foxp3CremiR-142fl/fl (KO, blue bar, n = 3), and Foxp3CremiR-142fl/flIfng−/− (DKO, green bar, n = 4) mice. (F) Thymus weights (1 lobe) in 6- to 8-week-old Foxp3Cre (WT, red bar), Foxp3CremiR-142fl/fl (KO, blue bar), and Foxp3CremiR-142fl/flIfng−/− (DKO, green bar) mice (n = 3 per group). (G) HE staining of liver tissue sections from Foxp3Cre (WT), Foxp3CremiR-142fl/fl (KO), and Foxp3CremiR-142fl/flIfng−/− (DKO) mice. Note diminished infiltration of leukocytes into liver tissue around portal vein area in DKO mice. Scale bar, 50 μm; p, portal vein. (H) Left panel, FACS analysis of CD44 and CD62L expression in splenic CD4+ T cells from 7- to 15-week-old Foxp3Cre, Foxp3CremiR-142fl/fl, and Foxp3CremiR-142fl/flIfng−/− mice. Numbers indicate percentage of cells in the quadrants. Right panel, frequency of CD44−CD62L+ naive CD4+ T cell in Foxp3Cre (WT, n = 7), Foxp3CremiR-142fl/fl (KO, n = 6), and Foxp3CremiR-142fl/flIfng−/− (DKO, n = 7) spleens. Results are shown as mean ± SD. P values were calculated using 2-tailed Student t test. *, P < 0.05; **, P < 0.01; ***, P < 0.001; ****, P < 0.0001. WT, Foxp3Cre; KO, Foxp3CremiR-142fl/fl; DKO, Foxp3CremiR-142fl/flIfng−/−. The underlying numerical raw data can be found in S1 Data file. The underlying flow cytometry raw data can be found at the Figshare repository. DKO, double knockout; FACS, fluorescence activated cell sorting; HE, hematoxylin–eosin; IFNγ, interferon gamma; KO, knockout; SD, standard deviation; WT, wild-type.

