
Fig 2. Topographic organization of spatial information encoding in astrocytes: somas versus processes.
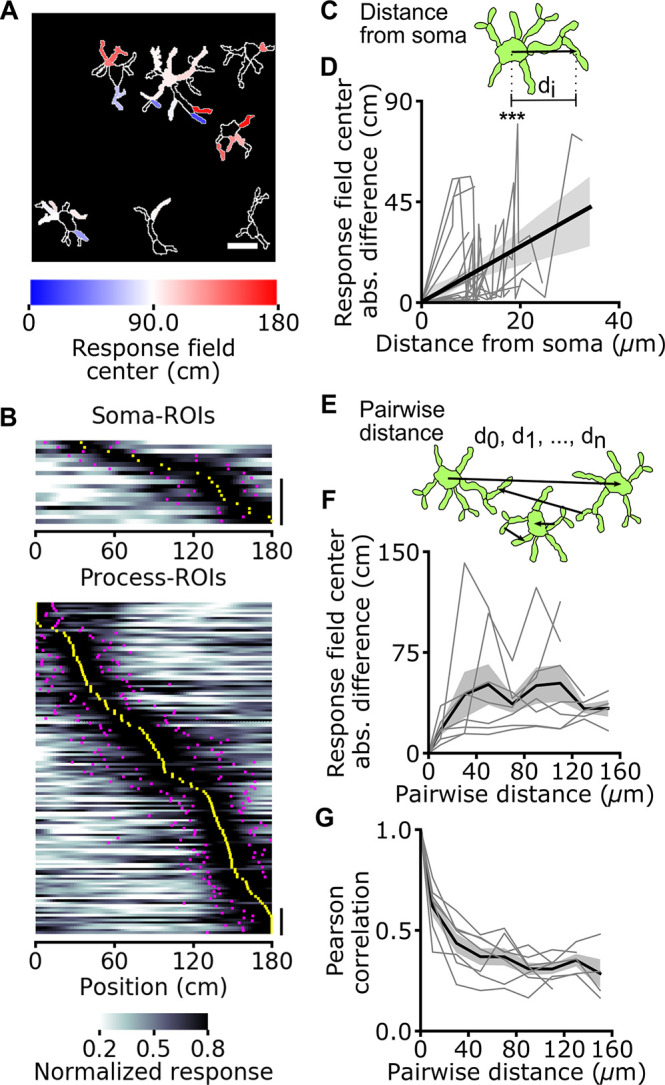
(A) Astrocytic ROIs in a representative FOV are color coded according to response field position along the virtual corridor. Scale bar: 20 μm. (B) Normalized astrocytic calcium responses as a function of position for astrocytic ROIs with reliable spatial information corresponding to somas (top) and processes (bottom) (somas: 19 ROIs with reliable spatial information out of 46 total ROIs; processes: 136 ROIs with reliable spatial information out of 310 total ROIs; data from 7 imaging sessions in 3 animals). Vertical scale: 10 ROIs. (C) Distance between the center of a process ROI and corresponding soma ROI computed for each astrocyte. (D) Absolute difference in response field position of a process ROI with respect to the field position of the corresponding soma ROI as a function of the distance between the 2 (R2 = 0.21, p = 3.2E-6, Wald test, data from 19 cells in which there was significant spatial modulation in the soma and at least 1 process; 7 imaging sessions on 3 animals). (E) The distance between the centers of pairs of ROIs (d0, d1, dn) is computed across recorded astrocytic ROIs. (F, G) Pearson correlation (F) and difference between response field position (G) for pairs of astrocytic ROIs containing reliable spatial information across the whole FOV as a function of pairwise ROI distance. Gray lines indicate single experiments, and black line and the gray shade indicate mean ± SEM, respectively. Data from 41 cells in which there was significant spatial modulation in at least 1 ROI; 7 imaging sessions in 3 animals. In this as well as in other figures: *, p < 0.05; **, p ≤ 0.01; ***, p ≤ 0.001. The data presented in this figure can be found in S1 Data. FOV, field of view; ROI, region of interest; SEM, standard error of the mean.