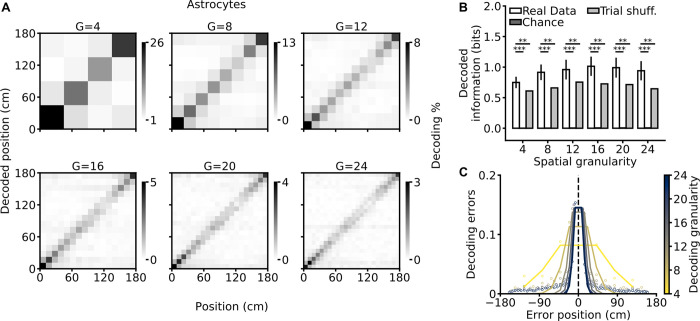
Fig 3. Efficient decoding of the animal’s spatial location from astrocytic calcium signals.
(A) Confusion matrices of an SVM classifier for different decoding granularities (G = 4, 8, 12, 16, 20, and 24). The actual position of the animal is shown on the x-axis, and decoded position is on the y-axis. The gray scale indicates the number of events in each matrix element. (B) Decoded information as a function of decoding granularity on real (white), chance (dark gray), and trial-shuffled (gray) data (see Methods). Trial shuffling disrupts temporal coupling within astrocytic population vectors while preserving single ROI activity patterns. Data are shown as mean ± SEM. See also S2 Table. (C) Decoding error as a function of the error position within the confusion matrix. The color code indicates decoding granularity. Data in all panels were obtained from 7 imaging sessions in 3 animals. The data presented in this figure can be found in S1 Data. ROI, region of interest; SEM, standard error of the mean; SVM, support vector machine.

