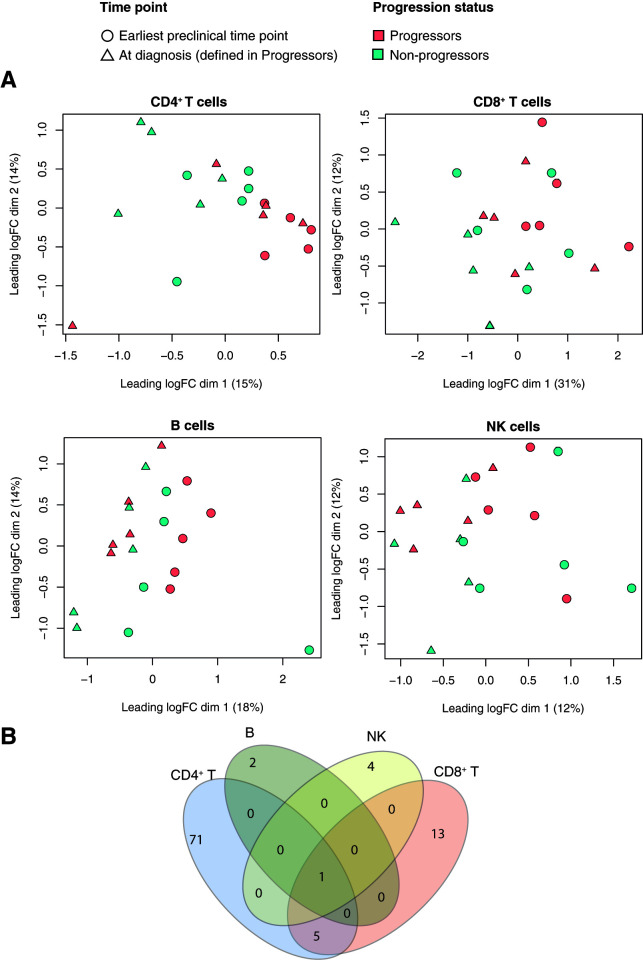
Figure 1.
Transcriptional changes in four immune cell types associated with progression to clinical T1D. A: MDS plots of RNA-seq log2 counts per million values with samples colored by progression status and shaped by time point for CD4+ T, CD8+ T, NK, and B cells. The log2 counts per million values are corrected for the age and batch variables. B: Venn diagram showing the number of overlapping DEGs between progressors and nonprogressors in the cell types analyzed. logFC, log2-fold change. dim, dimension.

