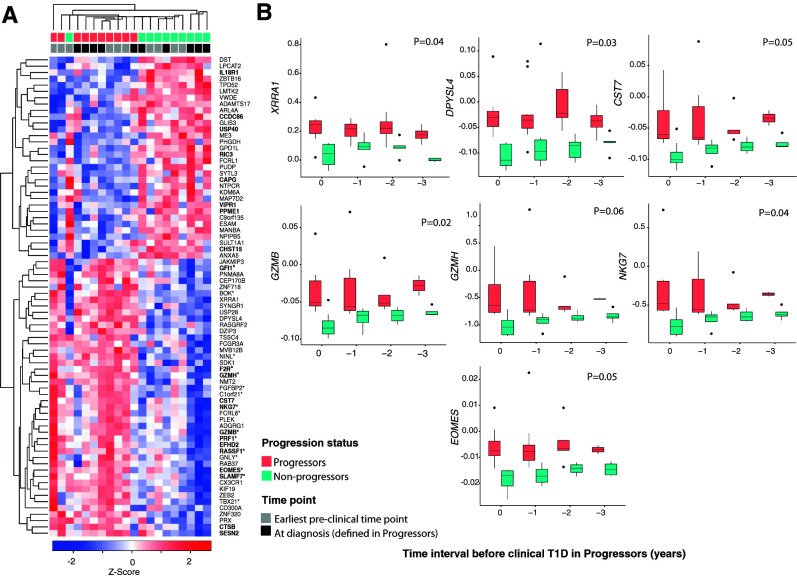
Figure 2.
Transcriptional changes in CD4+ T cells associated with progression to clinical T1D. A: Heat map of genes differentially expressed in CD4+ T cells, determined by RNA-seq, between progressors (n = 5) and nonprogressors (n = 5) in the discovery cohort at the earliest preclinical and at clinical diagnosis time points. The z score below the heat map represents the number of SD units a specific data point is from the mean (derived from the entire set of genes expressed in CD4+ T cells). Red and blue indicate increased and decreased expression, respectively. Samples and genes were arranged according to the ward.D2 clustering method with the function coolmap in the limma package. Genes with an asterisk denote cytotoxicity-related genes (19), while those in boldface type are EOMES target genes (21). Samples are color coded by progression status and time point. B: Box plots showing corrected (for age and batch) expression by RT-qPCR of DEGs over time in the validation cohort (n = 24). The x-axis shows time intervals measured in years from time 0 (clinical T1D in progressors). Number of samples tested in each time point is as follows: time 0, 9 nonprogressors and 8 progressors; time −1, 7 nonprogressors and 10 progressors; time −2, 6 nonprogressors and 8 progressors; and time −3, 5 nonprogressors and 4 progressors. Shown are the median (central horizontal line), interquartile range (boxes), values of the upper and lower quartiles (whiskers), and outliers beyond 1.5 interquartile range (filled circles). Statistical comparisons were performed using linear mixed models and included the progressor status * time point interaction term and adjustment for age, batch, and donor identifier as a random factor.

