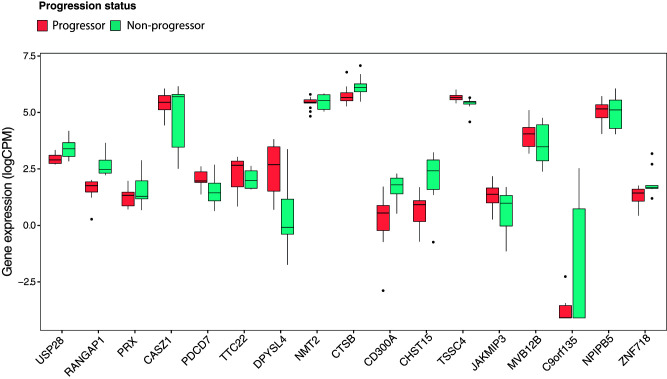
Figure 3.
Differential expression of genes in progressors in relation to seroconversion. A: Box plots showing normalized (log2 counts per million [logCPM]) expression values by RNA-seq in total CD4+ T cells from the Kallionpää et al. (7) data set (n = 14). DEGs plotted represent genes differentially expressed between progressors and nonprogressors to T1D both before and after seroconversion. Preseroconversion DEGs were defined using data from Kallionpää et al. (7), while postseroconversion DEGs were from the current study. Shown are the median (central horizontal line), interquartile range (boxes), values of the upper and lower quartiles (whiskers), and outliers beyond 1.5 interquartile range (circles).

