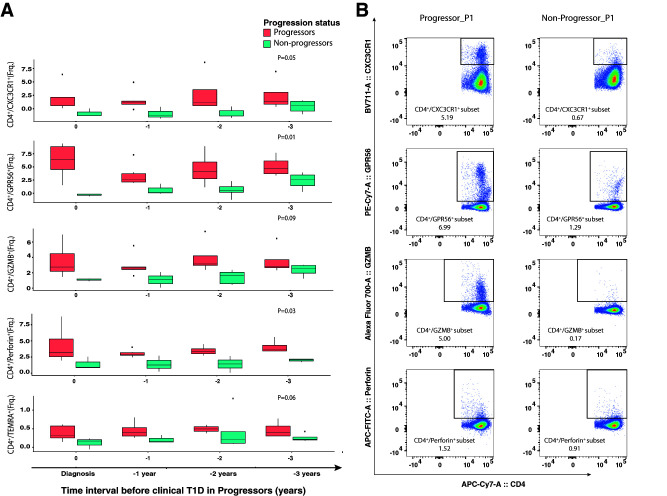
Figure 4.
Expression of cytotoxicity-related proteins in CD4+ T cells during progression to clinical T1D. A: Box plots showing the frequency (Frq.) of CD4+/CXC3CR1+, CD4+/GPR56+, CD4+/GZMB+, and CD4+/perforin+ measured by flow cytometry in progressors (n = 5) and nonprogressors (n = 5) over the period of observation. The x-axis shows time intervals measured in years from time 0 (clinical T1D in progressors). Shown are median (central horizontal line), interquartile range (boxes), values of the upper and lower quartiles (whiskers), and outliers beyond 1.5 interquartile range (circles). Statistical comparisons were performed using linear mixed models that included the progressor status * time point interaction term and were adjusted for age, batch, and donor identifier as a random factor. B: Flow cytometry data for CD4 vs. CX3CR1, CD4 vs. GPR56, CD4 vs. GZMB, and CD4 vs. perforin (after gating on CD3+ and CD4+ T cells) from a representative progressor and nonprogressor. APC, allophycocyanin; PE, phycoerythrin.

