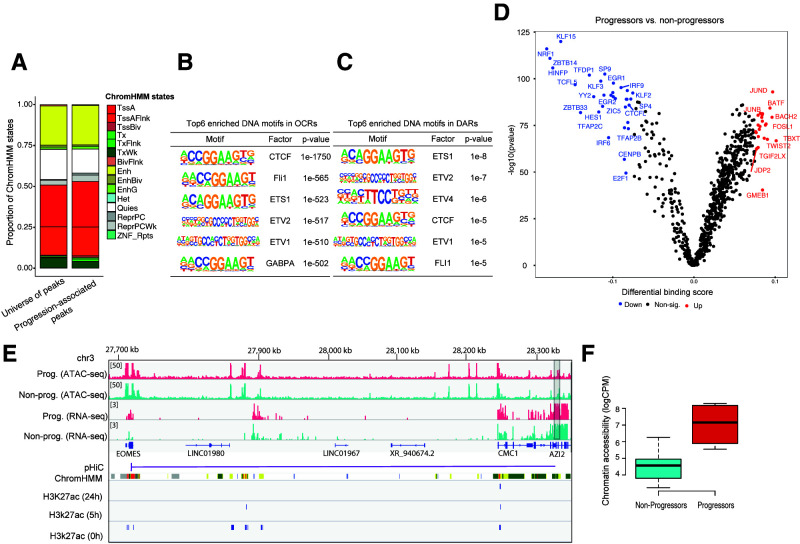
Figure 5.
Chromatin accessibility changes in CD4+ T cells associated with progression to clinical T1D. A: Bar plots showing the distribution of predicted chromatin states (using the ChromHMM states from the Roadmap Epigenomics Project) in both the complete set of OCRs and progression-associated DARs. BivFlnk, flanking bivalent TSS/enhancer; Enh, enhancers; EnhBiv, bivalent enhancer; EnhG, genic enhancers; Het, heterochromatin; Non-sig, nonsignificant; TssA, active TSS; TssAFlnk, flanking active TSS; TssBiv, bivalent/poised TSS; Tx, strong transcription; TxFlnk, transcription at gene 50 and 30; TxWk, weak transcription; Quies, quiescent/low; ReprPC, repressed polycomb; ReprPCWk, weak repressed polycomb; ZNF/Rpts, ZNF genes and repeats. B: Top six enriched DNA motifs in OCRs. C: Top six enriched DNA motifs in DARs. D: Pairwise comparison of TF activity between progressors and nonprogressors. The volcano plot shows the differential binding score against the −log10 (P value) (from TOBIAS) of all analyzed TF motifs, where each dot represents one motif. TFs with increased occupancy in progressors are labeled in red, while those with decreased occupancy are labeled in blue. E: Normalized read coverage plots of ATAC-seq and RNA-seq libraries around EOMES loci in both progressors (Prog.) (red) and nonprogressors (Non-prog.) (turquoise). The DAR is indicated by a gray rectangle at the right-hand side. pHiC shows promoter-enhancer interactions in primary CD4+ T cells predicted by pHiC (26) overlapping the DAR. ChromHMM shows ChromHMM tracks from Roadmap Epigenomics Project for “Primary T helper naive cells from peripheral blood” (E038). F: Box plot showing normalized (log2 counts per million [logCPM]) chromatin accessibility data (nonadjusted for age) in DAR linked to EOMES.

