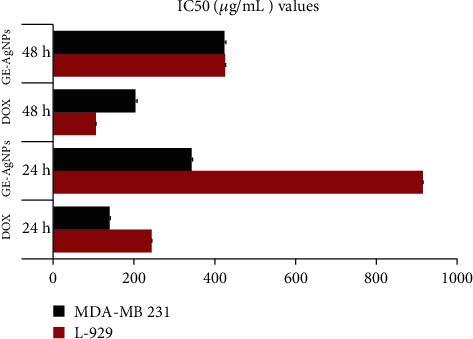
Figure 10.

Cell viability (IC50 value) of MDA-MB-231, L-929, after treatment with different nanoformulations (Dox: doxorubicin (control), GE-AgNPs) after 24 and 48 h. Error bar represents standard deviation of mean. ∗p ≤ 0.05. Significant difference (p ≤ 0.05) within a parameter between two lines is denoted by asterisk.
