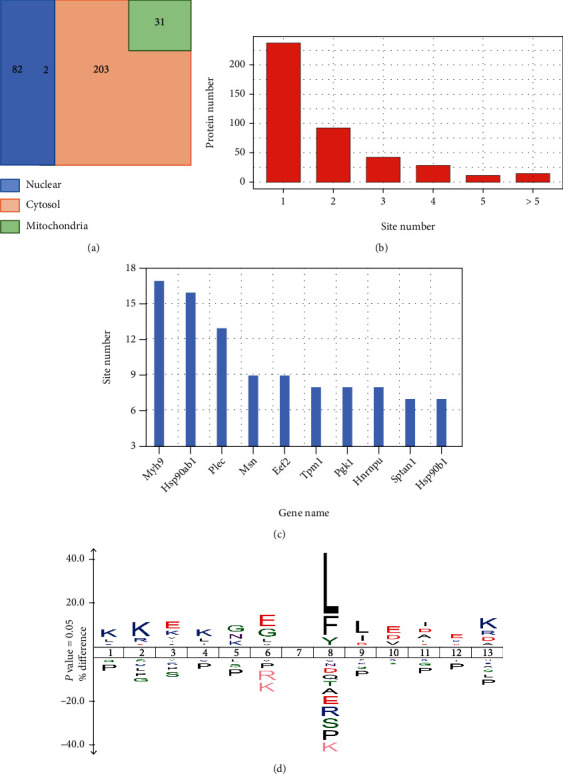
Figure 2.

Characterization of Kbhb proteome. (a) Venn diagram shows cellular compartment distribution of Kbhb proteins. (b) Distribution of the Kbhb sites number per protein. (c) The bar graph shows the proteins containing more than 6 Kbhb sites. (d) Consensus sequence logo shows a representative sequence for BHB-induced Kbhb sites.
