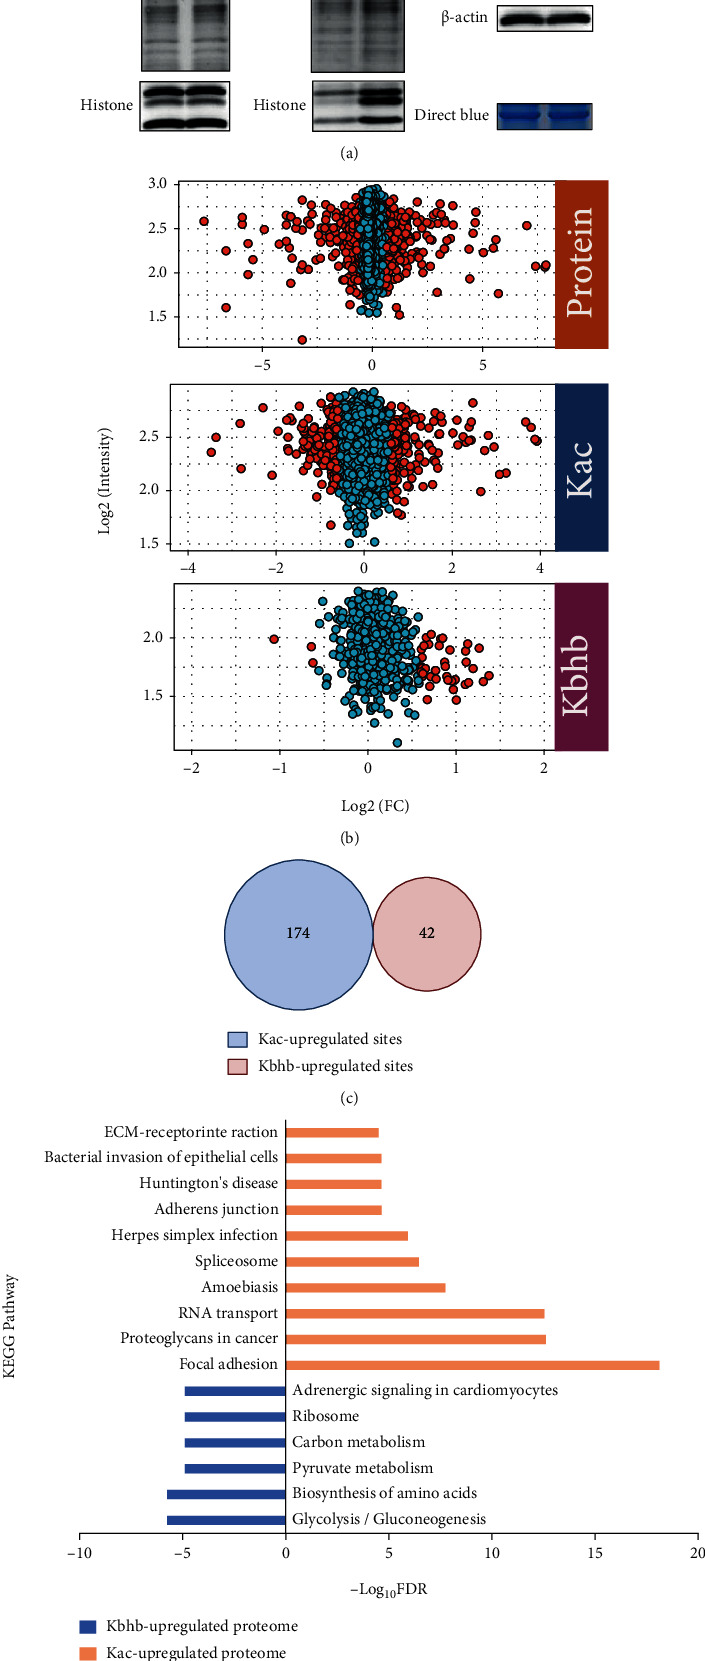
Figure 3.

Quantitative analysis of BHB-induced Kbhb and Kac proteome. (a) BHB enhances Kbhb of proteins in MEF cells. Histone Kbhb and Kac levels were analyzed in control and BHB treated MEF cells by immuno-blotting with the indicated antibodies. (b) The scatter plot shows quantification of Kbhb and Kac sites. (c) Venn diagram shows no crossover between the upregulated Kbhb and Kac sites. (d) The KEGG pathway of Kbhb and Kac proteome induced by BHB.
