
Figure 1.
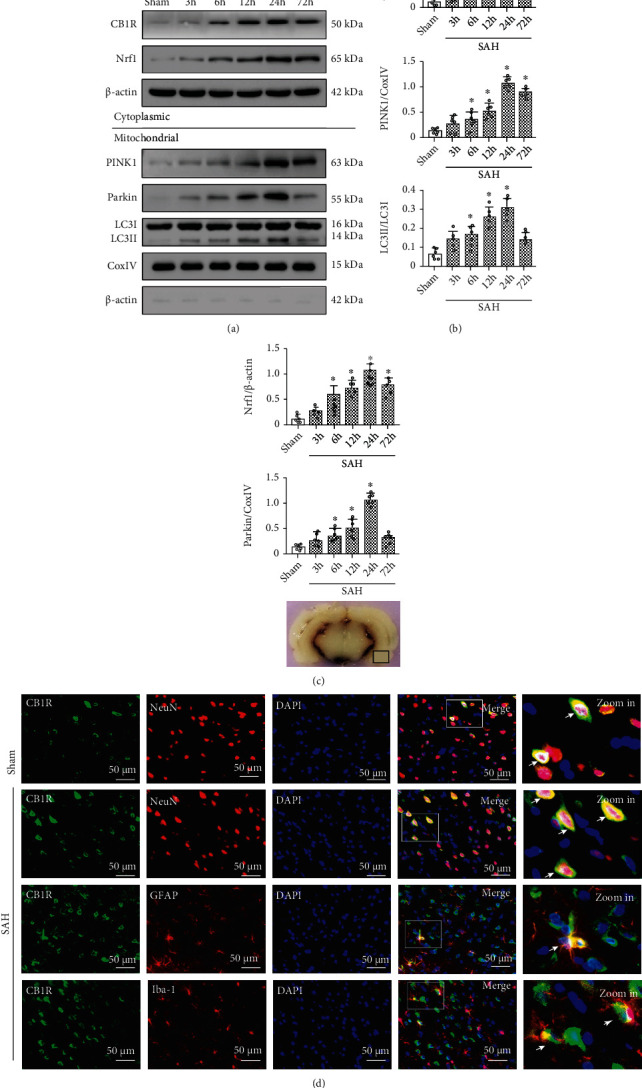
Time course expression of CB1R, Nrf1, PINK1, Parkin, and LC3II and cellular localization of CB1R after SAH. (a) Representative Western blot images of time course and (b) quantitative analyses of CB1R, Nrf1, PINK1, Parkin, and LC3II. n = 6 per group. Data were represented as mean ± SD. ∗p < 0.05 vs. the Sham group. (c) Representative picture indicates the location of immunofluorescence staining (small black box). (d) Representative microphotographs of immunofluorescence staining for CB1R (green) with neurons (NeuN, red), astrocytes (GFAP, red), and microglia (Iba-1, red) in the left temporal cortex at 24 h after SAH. Nuclei were stained with DAPI (blue). n = 3 per group. Scale bar = 50 μm.