
Figure 7.
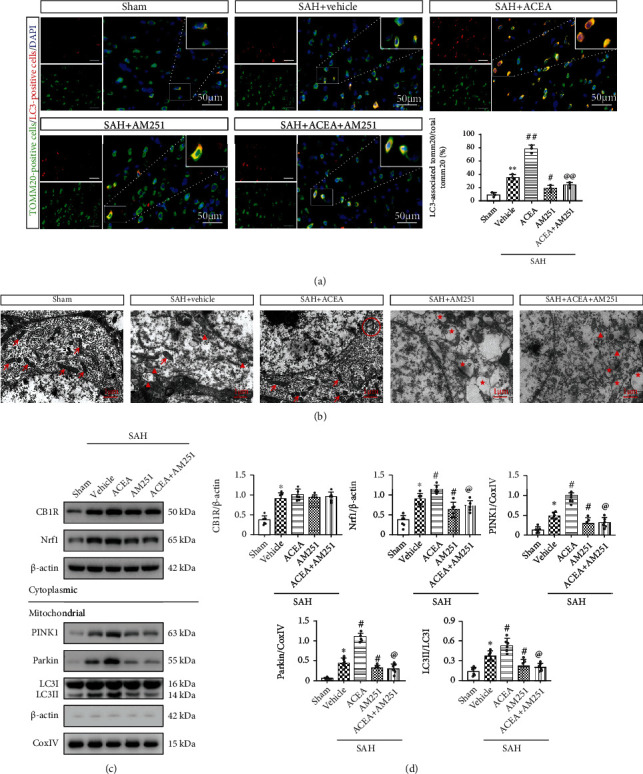
ACEA promoted mitophagy and improved mitochondrial morphology, which was reversed by AM251. (a) Representative immunofluorescence colocalization of Tomm20 (mitochondrial marker, green) with LC3 (autophagosome marker, red) and quantification of the ratio of LC3-associated Tomm20 to total Tomm20. Scale bar = 50 μm. n = 3 per group. (b) Neuronal and mitochondrial structures were observed by TEM. Red arrow: normal mitochondria; red triangle: swollen mitochondria; red circle: mitophagosome; red star: mitochondrial vacuolization. Scale bar = 1 μm. (c) Representative Western blot images. (d) Quantitative analyses of CB1R, Nrf1, PINK1, Parkin, and LC3II. n = 6 per group. Data were expressed as mean ± SD. ∗p < 0.05 and ∗∗p < 0.01 vs. the Sham group; #p < 0.05 and ##p < 0.01 vs. the SAH+vehicle group; @p < 0.05 and @@p < 0.01 vs. the SAH+ACEA group.