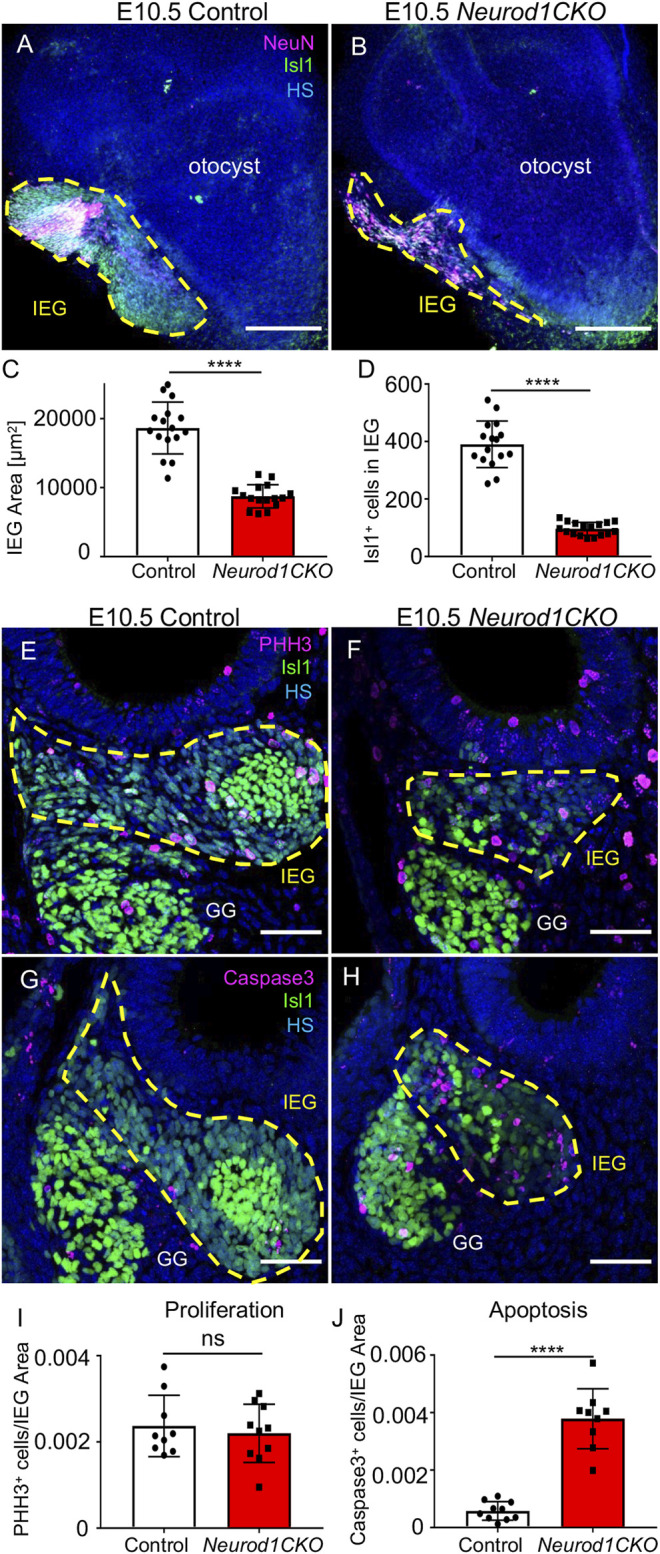
FIGURE 4.

Diminished inner ear ganglion and massive apoptosis are detected in Neurod1CKO at E10.5. (A,B) Representative whole-mount immunolabeling of the otocyst shows the size of otic ganglia (dotted line area) with anti-Isl1 and anti-NeuN (a nuclear marker of neurons). (C,D) Quantification of the ganglion size and number of ISL1+ neurons in the inner ear ganglion. The values represent mean ± SD, t-test, ****p ≤ 0.0001 (n = 10 embryos/genotype, 16 vibratome sections/embryo). (E,F) Immunohistochemistry for Phosphohistone H3 (PHH3) and ISL1 shows proliferating neurons in the otic ganglion (dotted line area) in the vibratome sections of Neurod1CKO and control embryos. (G,H) Anti-Cleaved Caspase3-labeled apoptotic cells are shown in the ISL1+ ganglion area (delineated by the dotted line) at E10.5. (I) A number of proliferating neurons and (J) apoptotic neurons per the ganglion area were counted in the vibratome sections of Neurod1CKO and control embryos. The values represent means ± SD, t-test; ns, not significant; ****p ≤ 0.0001 (n = 5 embryos/genotype). Scale bars: 200 µm (A,B); 50 µm (E–H). GG, geniculate ganglion; HS, Hoechst nuclear staining; IEG, inner ear/otic ganglion.
