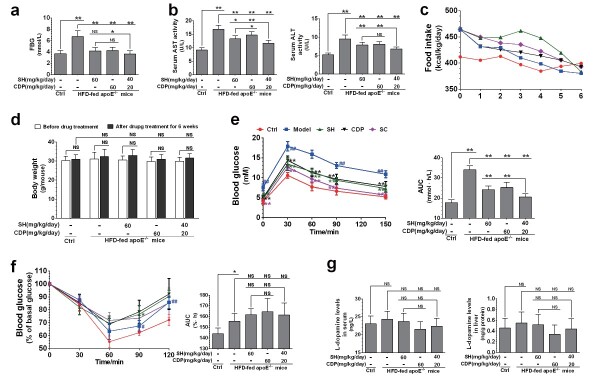
Fig.3. FBG, AST, and ALT activity, food intake, and body weight in HFD-fed ApoE −/− mice .
FBG (a), serum AST and ALT activity (b), food intake (c), body weight (d), glucose tolerance test (GTT) with blood glucose levels (left) and area under the blood glucose curve (AUC, right) (e), and insulin tolerance test (ITT) with blood glucose levels (left) and AUC (right) (f), L-dopamine levels (g) in control (Ctrl), and HFD-fed ApoE −/− mice (Model) and in SH-, CDP-, and SH+CDP (SC)-co-treated mice. Data are presented as the mean±SD. Except for five of eight per group in GTT and ITT, the others were from all eight rats per group. * P <0.05, ** P <0.01; ## P <0.01 vs. Ctrl and ** P <0.01 vs. Model in GTT and ITT. Abbreviations: NS, not significant; SH, sarpogrelate hydrochloride; CDP, carbidopa.

