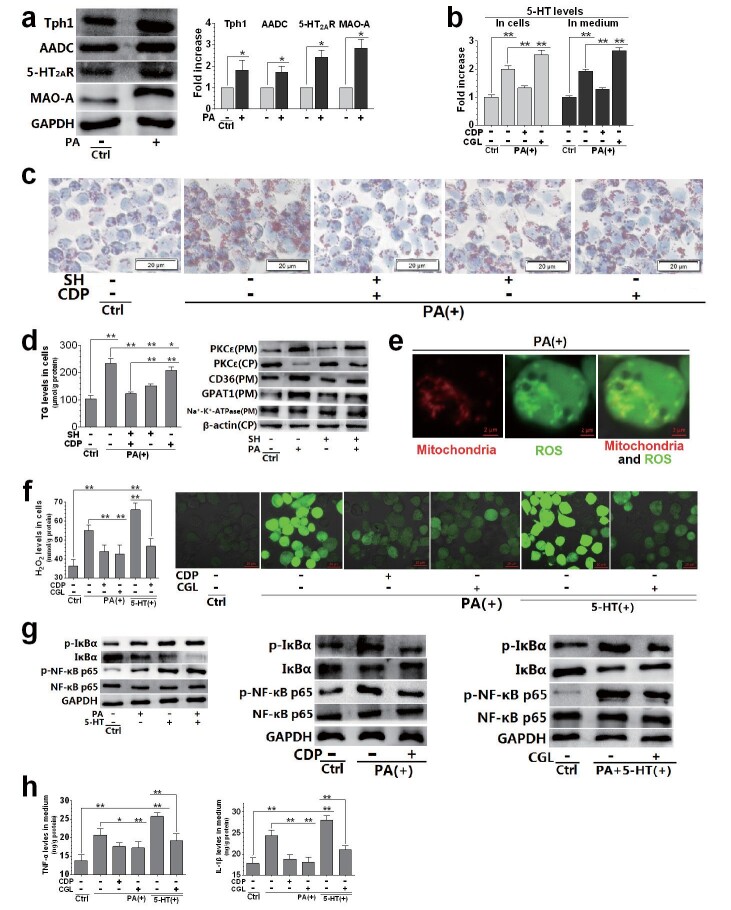
Fig.5. Relationship between 5-HT system activation and PA-induced dysfunctions in THP-1 cell-derived macrophages.
Macrophages were treated with SH (30 µM), CDP (30 µM), CGL (10 µM), PA (200 µM), and 5-HT (50 µM). The cells were pre-treated with each drug for 24 h, followed by PA and 5-HT treatment (alone or in combination) for another 12 h. Whole-cell protein levels and their densitometric analysis of Tph1, AADC, 5-HT 2A R and MAO-A were evaluated using the western blot (with GAPDH as the loading control) (a). ELISA was used to measure intracellular and extracellular 5-HT levels (b); medium levels of TNF-α (h, left) and IL-1β (h, right). Representative lipid droplets determined by oil red O staining (40×) (c).TG levels (d, left) and protein levels of PKCε, CD36, GPAT1, Na + -K + -ATPase, and β-actin (d, right). Mitochondria and ROS distribution in the PA-treated cells determined by co-localization of mitochondria and ROS fluorescent dye staining (63×3×) (e). H 2 O 2 levels (f, left) and ROS distribution (fluorescent dye staining, 31.5×) (f, right). Whole-cell protein levels of phosphorylated (p-) IκBα, IκBα, p-NF-κB p65, NF-κB p65, and GAPDH in control (Ctrl), 5-HT and PA (alone or in combination)-treated cells (g, left), Ctrl, PA with or without CDP-treated cells (g, middle), and Ctrl, PA+5-HT-co-treated with or without CGL-treated cells (g, right). Data are presented as the mean±SD of at least four independent experiments. * P <0.05, ** P <0.01. Abbreviations: SH, sarpogrelate hydrochloride; CDP, carbidopa; CGL, clorgyline; CP, cytoplasm; PM, plasmalemma.

