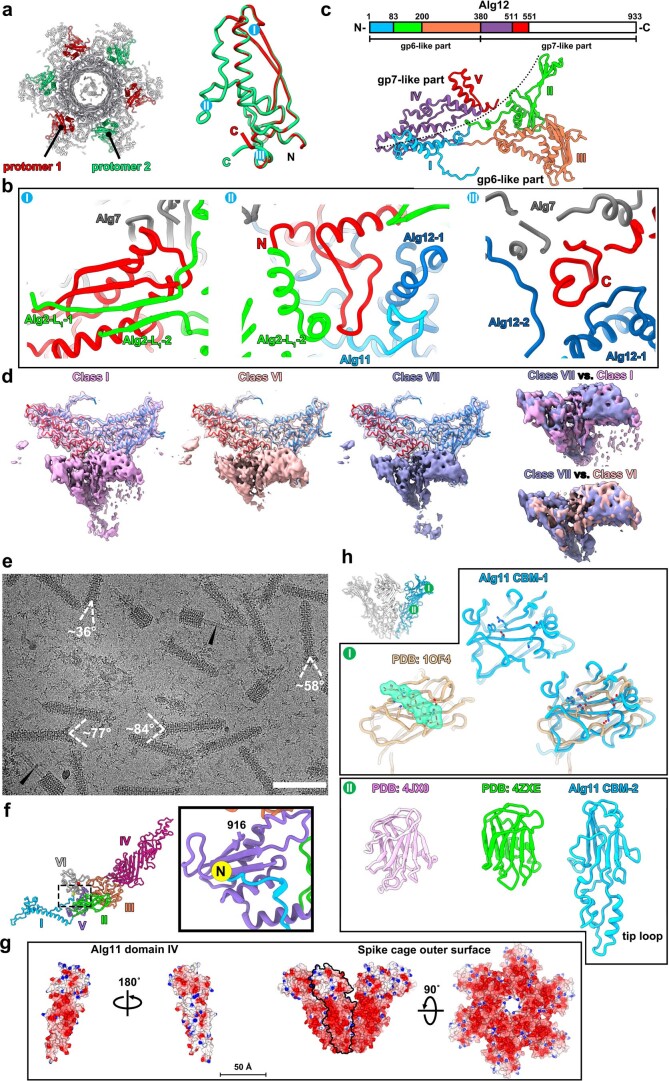
Extended Data Fig. 7. Structural analyses of the AlgoCIS baseplate wedge.
a: Ribbon diagram of a perpendicular slice of the AlgoCIS baseplate showing the positions of two different Alg9 protomers (protomer 1: red; protomer 2: green). The other components are colored white. The structural superposition of two Alg9 protomers is shown in the right panel. b: Magnified views of ribbon diagrams showing the interactions between Alg9 (protomer1: red) and other baseplate components (Alg2-L1, Alg7, Alg11, and Alg12), which are related to the parts I-III in (a). The color code for different proteins matches Fig. 1d. c: Schematic and ribbon diagrams showing the domain organization of Alg12. The C-terminal part without structural modeling is colored white. The boundary between gp6-like and gp7-like part is marked with dashed line. d: Shadowed surface and ribbon diagrams showing the structural dynamics of the peripheral baseplate in 3D classification analyses. The densities around built-up models are shown transparent, while the dynamic peripheral parts are shown in solid surface. The pair comparisons of dynamic parts between different classes are shown in the right panel. The gp6-like and gp7-like part of Alg12 model is colored blue and red. The color code for different classes matches the 3D classification part in Extended Data Fig. 2a. e: Representative cryoEM image showing the dynamics of tail fibers in the extended AlgoCIS particles. The angles in individual particles were measured and labeled. The lumen of expelled inner tubes (highlighted by black arrowheads) are observed empty upon firing. Bar: 50 nm. f: Ribbon diagram showing the domain organization of Alg11. The color code for different domains matches Fig. 4b. Box indicates the β-sheet assembly of the N-terminal strand and the domain V, which is shown in the right panel. g: Surface electrostatic potentials of the Alg11 domain IV and the overall outer surface of the spike cage revealing that the outer surface of the spike cage is dominated by negative charges, with a positively charged residue (Lys 572) located at the tip. The boundary of one protomer is marked by black contour. Negative and positive electrostatic potentials are colored red and blue, respectively. Bar: 50 Å. h: Ribbon diagrams showing the structures of carbohydrate binding modules (CBM1/2) in Alg11 and the related homologous proteins. Top-left: the overall structure of spike cage. Box I corresponding to part I in the top-left panel: ribbon diagrams showing that the CBM1 might potentially bind to sugar as the homologous protein (PDB entry: 1OF4)39. The surface of sugar is shown in green transparent. The structural superimposition reveals that the residues, participating in the contacts with substrates, are well-conserved in the CBM1. Box II corresponding to part II in the top-left panel: ribbon diagrams showing the structures of CBM2 and the homologous proteins (PDB entries: 4ZXE and 4JX0)79.

