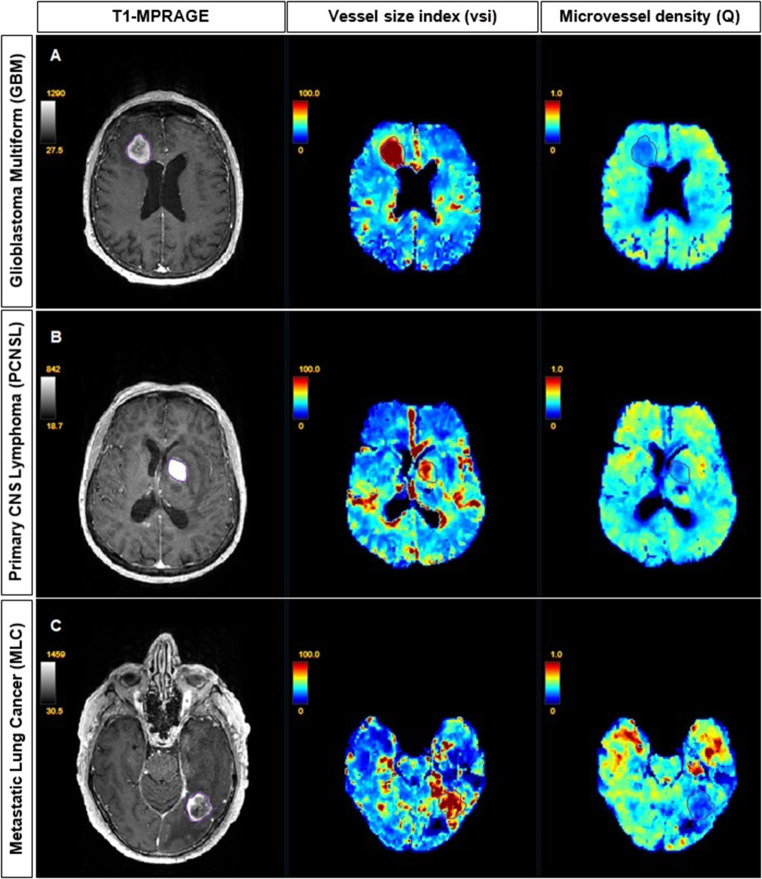
Fig. 2.
VSI maps shown using the NORA medical imaging platform in patients with a glioblastoma multiforme, b primary CNS lymphoma, c metastatic lung cancer. Left: post-contrast T1-weighted images showing enhancement of tumor regions. Middle: corresponding mean vessel diameter (vsi) maps. Right: corresponding microvessel density (Q) maps. Tumor regions show elevated mean vessel diameters with decreased microvessel densities compared to healthy tissues

