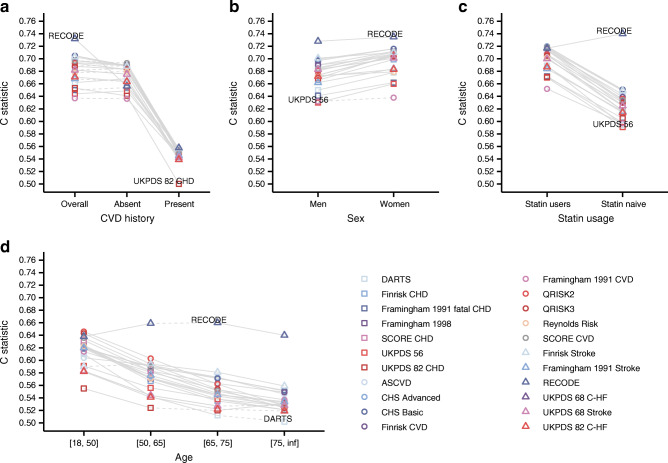
Fig. 7.
Subgroup-specific discrimination of 22 scores predicting CVD in individuals with type 2 diabetes irrespective of their history of CVD at the time of type 2 diabetes diagnosis. Results were based on imputed data (all individuals with type 2 diabetes irrespective of their baseline CVD status) and based on 90% of the data used for external validation. Point estimates and 95% CI are presented in ESM Tables 17–20. Plots are stratified by (a) CVD history at baseline, (b) sex, (c) statin use and (d) age. Dashed lines indicate non-significant (at an α of 0.05) difference between subgroup-specific C statistics, with solid lines indicating significant differences. Inf, positive infinity

