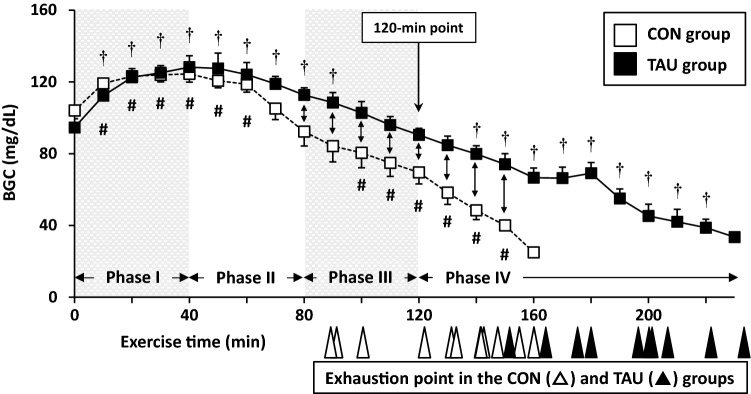
Fig. 2.
Overtime changes in BGC during treadmill exercise until exhaustion. Blood was collected every 10 min from the jugular vein via cannulation. Exercise period was divided by every 40 min into four phases; Phase I: 0–40 min, Phase II: 50–80 min, Phase III: 90–120 min, Phase IV: over 125 min. Individual exhaustion time is indicated by arrows (white: CON group [n = 12], black: TAU group [n = 10]) under the X-axis. The 120-min point is the approximate median where there were significant differences in BGC between the two groups at exercise point every 10 min (80–150 min). Values are expressed as the mean ± SE. †P < 0.05 and #P < 0.05 show significant difference to the respective starting point (0 min) in the TAU and CON groups, respectively, as analyzed by repeated-measure ANOVA followed by Bonferroni post hoc test. Arrow with two heads ( ↔) shows a significant difference at P < 0.05 between the two groups at each point

