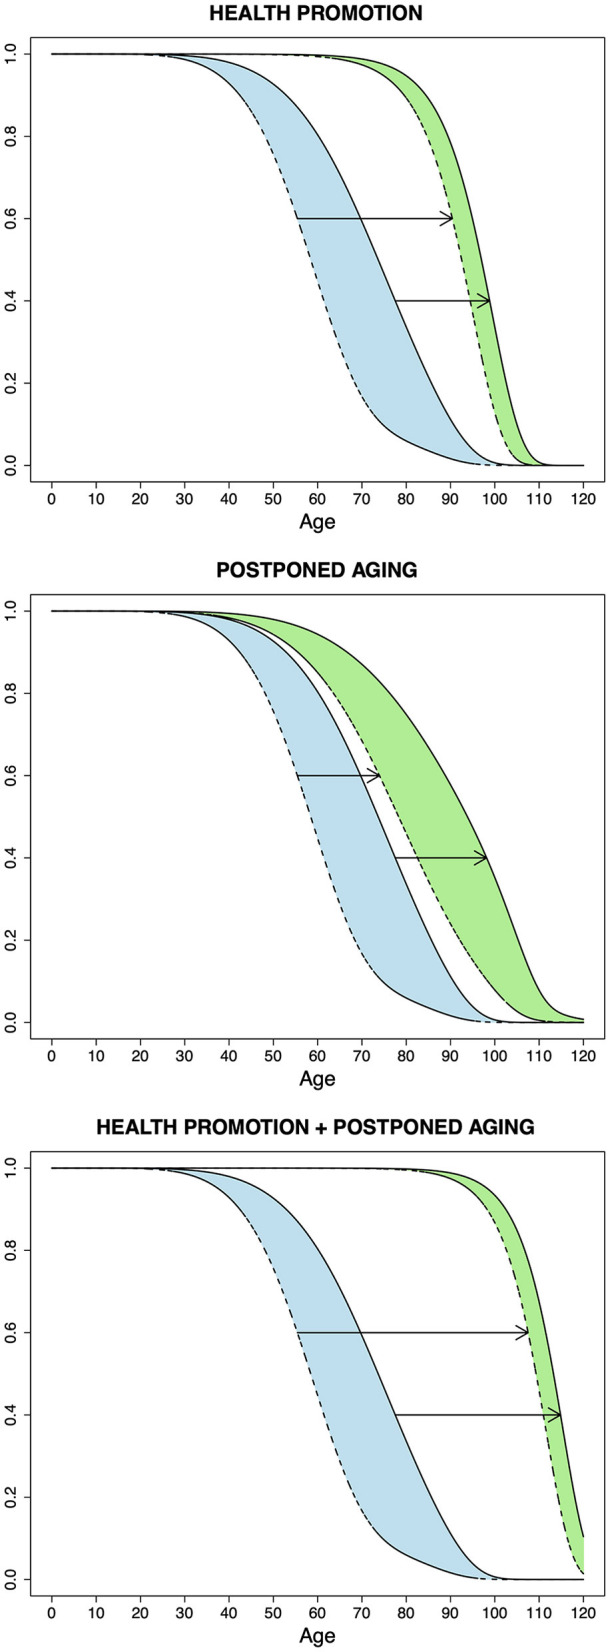
Figure 2.

Prospects for healthy aging according to the scenarios of health promotion, postponed aging, and the two scenarios combined, using hypothetical survival functions for incidence of aging-related diseases (dashed lines) and for intrinsic mortality (continuous lines). The upper and lower arrows show the shift in the morbidity and mortality curves, respectively, under each scenario. The colored areas correspond to years lived with disease or unhealthy years; this is represented before (blue) and after (green) achieving the outcome in each of the scenarios. A reduction in these areas is consistent with the compression of morbidity hypothesis and occurs under health promotion and the two scenarios combined. The Gompertz distribution was used for the outer “rectangularized” morbidity and mortality curves in the top and bottom graphs; all other curves were drawn using a mixture of the Gompertz and Weibull distributions.
