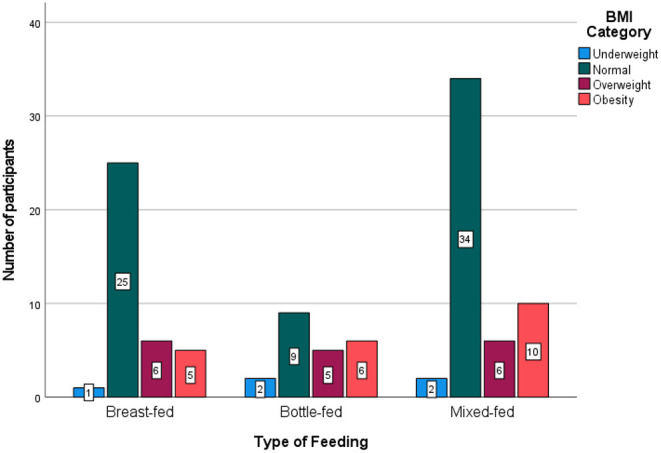
Figure 4.

Body mass index (BMI) categories among the three feeding groups. The BMI measures were normal, more often in the breastfed group (68%) than in other groups (e.g., 41% in the bottle-fed group), and more obese BMI levels were seen in the bottle-fed group than in other groups (P = 0.435).
