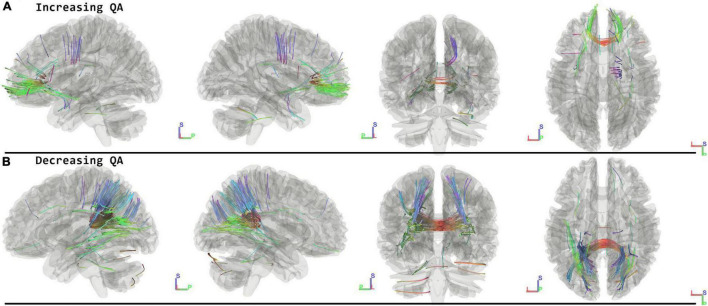
FIGURE 3.
Tracts Associated with changes of followup minus postflight. Increasing QA shows changes in forceps minor, corpus callosum, corticostriatal, and right cingulum (FDR = 0.0567) (A). Decreasing QA shows changes in the forceps major, corpus callosum, and parietal lobe (FDR = 0.0014) (B). Blue indicates superior – inferior. Green indicates anterior – posterior. Red indicates left – right.

