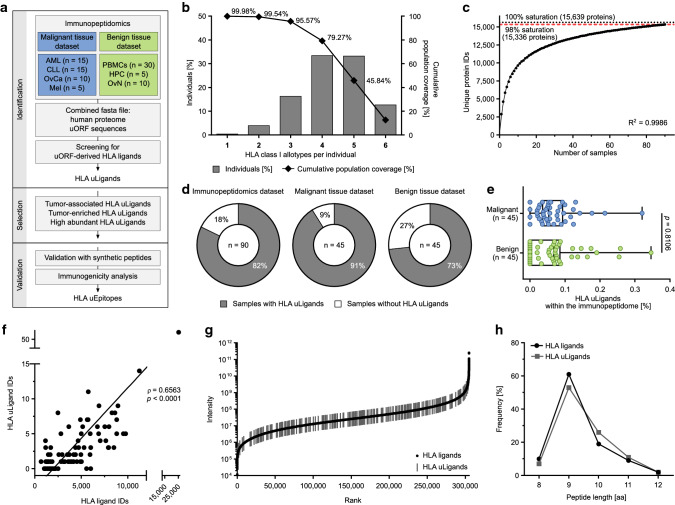
Fig. 3.
Mass spectrometry-based identification of uORF-derived HLA ligands. a Workflow of immunopeptidomics-based identification of uORF-derived HLA ligands (HLA uLigands) and T cell epitopes (HLA uEpitopes). b HLA class I allotype population coverage within the immunopeptidomics dataset (n = 90) compared to the world population (calculated by the IEDB population coverage tool, www.iedb.org). The frequencies of individuals within the world population carrying up to six HLA allotypes (x-axis) included in the immunopeptidomics dataset are indicated as grey bars on the left y-axis. The cumulative percentage of population coverage is depicted as black dots on the right y-axis. c Saturation analysis of HLA ligand source proteins of the immunopeptidomics dataset (n = 90). Number of unique HLA ligand source protein identifications shown as a function of cumulative immunopeptidome analysis. Exponential regression allowed for the robust calculation (R2 = 0.9986) of the maximum attainable number of different source protein identifications (100% saturation, dotted line). The dashed red line depicts the source proteome coverage achieved in the immunopeptidome dataset. d Pie charts depicting the percentage of samples with identified HLA uLigands within the total immunopeptidomics dataset comprising malignant and benign tissue samples (n = 90, left panel) as well as within the malignant (n = 45, middle panel) and benign (n = 45, right panel) tissue datasets separately. e Percentage of HLA uLigands within the immunopeptidome of malignant and benign tissue samples (boxes represent median and 25th–75th percentiles, whiskers are minimum to maximum, two-sided Mann–Whitney U-test). f Correlation of total HLA ligand identifications with HLA uLigand identifications in the immunopeptidome dataset (n = 90). Dots represent individual samples. Spearman’s rho (ρ) and p-value. g Ranked intensity values of mass spectrometry-acquired data derived from the combined immunopeptidomes of all samples (n = 90). Positions of HLA uLigands are projected on the curve. h Peptide length distribution of HLA uLigands and all identified HLA ligands. AML acute myeloid leukemia, CLL chronic lymphocytic leukemia, OvCa ovarian carcinoma, Mel melanoma, PBMCs peripheral blood mononuclear cells, HPC CD34-enriched hematopoietic progenitor cells, OvN benign ovaries, HLA uLigands uORF-derived HLA ligands, IDs identifications, aa amino acid

