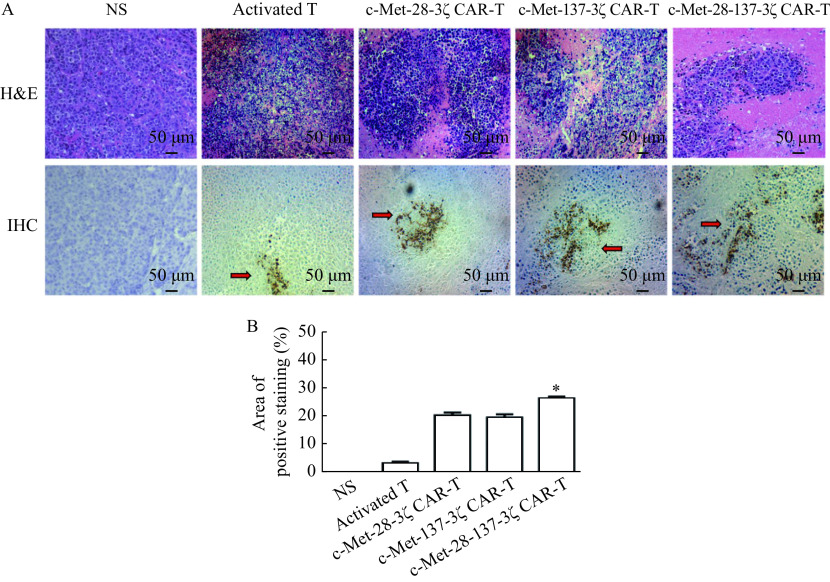
Figure 5.
H&E and immunohistochemistry staining of the tumor tissues.
Tumor samples from the mice treated with c-Met CAR-T cells were stained for human CD3 by H&E and IHC staining to detect the human T cell infiltration. A: Representative pictures of H&E and IHC staining analysis of the human T cell infiltration in tumor samples for anti-CD3. Magnification, 200×; Scale bar, 50 μm. B: Quantitative analysis of CD3 positive staining region. Data were the mean±SEM from triplicates. Statistical analyses were performed by one-way ANOVA for comparisons between multiple groups with a single variable.*P<0.05. H&E: hematoxylin and eosin; IHC: immunohistochemistry. The arrow indicates the infiltrating T cells. NS: 0.9% NaCl.

