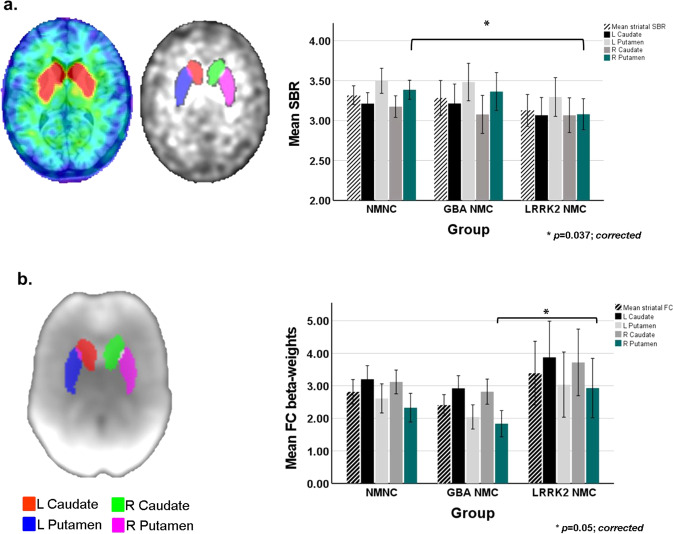
Fig. 1. Striatal binding ratios (SBRs) and functional connectivity (FC) levels measured in the three study groups.
a Illustration of striatal regions of interest (ROIs) superimposed on a DaTscan image (left panel). Bar chart demonstrating between-group differences in calculated SBR within the striatal ROIs (right panel). b Illustration of striatal ROIs superimposed on calculated BGN spatial map (left panel). Bar chart demonstrating between-group differences in measured FC levels within the striatal ROIs (right panel). Bars represent the calculated group means, standard deviations (SD) are represented by the error bars.

