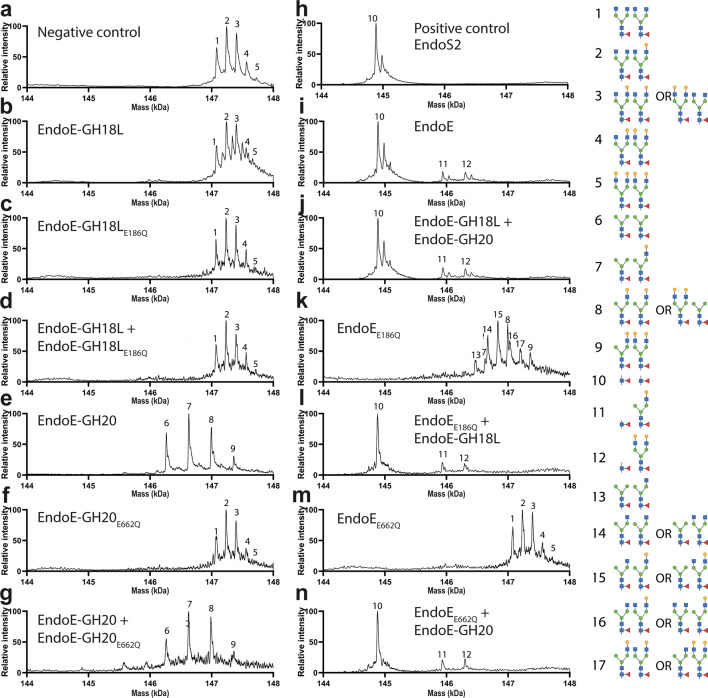
Fig. 5. Molecular basis of EndoE GH18 and GH20 domains substrate specificity as visualized by LC/MS.
Processing of CT N-glycans on Rituximab. Mass spectrometry of Rituximab treated with a no enzyme (negative control) b EndoE-GH18L c EndoE-GH18LE186Q d EndoE-GH18L + EndoE-GH18LE186Q e EndoE-GH20 f EndoE-GH20E662Q g EndoE-GH20 + EndoE-GH20E662Q h EndoS2 (positive control) i EndoE j EndoE-GH18L + EndoE-GH20 k EndoEE186Q l EndoEE186Q + EndoE-GH18L m EndoEE662Q n EndoEE662Q + EndoE-GH20. The peaks corresponding to intact Rituximab are numbered based on the glycoforms found in each heavy chain. The retention time for Rituximab was 2.4 min. For mass deconvolution, the following parameters were used in the BioConfirm software; 2000–7000 m/z and 14.4–14.8 kDa. The theoretical and observed mass of each annotated peak are in Supplementary Table 4.

