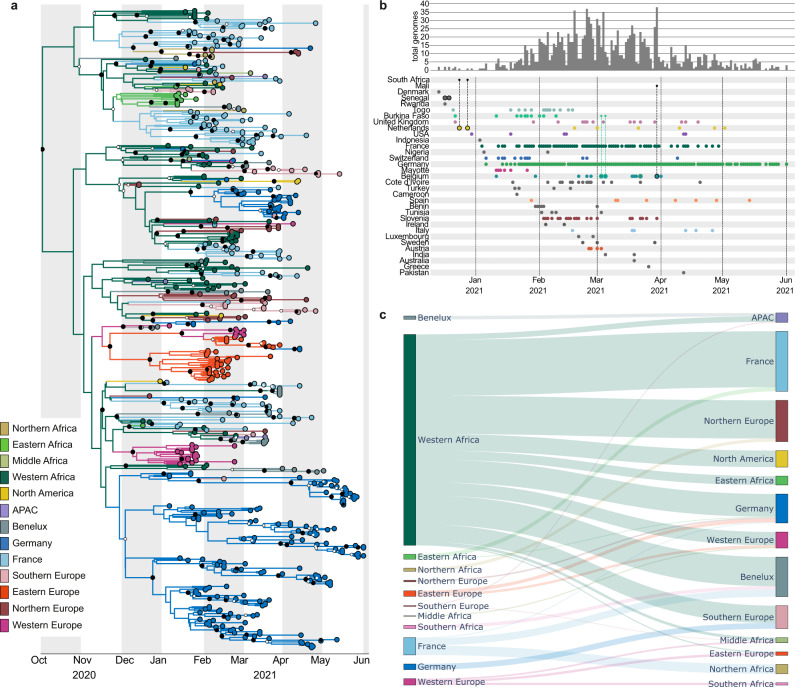
Fig. 2. Origins of SARS-CoV-2 lineage A.27.
a Region-annotated phylogeny, showing an inferred origin of the A.27 lineage in Western Africa with subsequent spread to most of the other regions where A.27 was detected. Smaller white circles represent posterior support >0.5, whereas bigger black circles represent posterior support >0.95. b Known locations, dates and individual travel histories of A.27 cases. Rows show the collection dates of genomes on the bottom, as well as the frequency of genomes as a bar plot at the top. The origin and destination is shown for travel cases: genomes with associated travel history are outlined with the color corresponding to the origin location, and are connected to this origin location with a smaller dot. c Sankey plot showing the number of transitions between locations through the estimated number of Markov jumps. The thickness of the lines are proportional to the number of Markov jumps from the location to the left into the location on the right, conditional on the corresponding Bayes factor being higher than 3, pointing to strong support for an inferred origin of the A.27 lineage in Western Africa. Input XML files of the phylogeographic analysis are supplied in the Supplementary Data 1.

