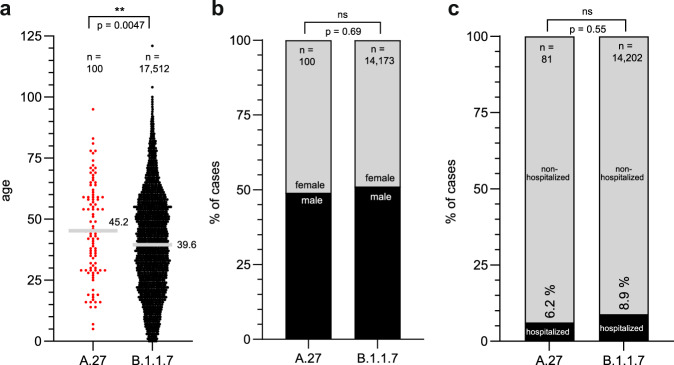
Fig. 3. Metadata analysis of patients infected with A.27.
Metadata of confirmed A.27 and B.1.1.7 infected patients was acquired from the RKI and GISAID. a Scatter plot of the age distribution of patients infected with B.1.1.7 or A.27 patients. Displayed is the mean age. Statistical analysis was performed with a two-sided t-test (**p < 0.01). b Gender distribution and (c) hospitalization rate of B.1.1.7 and A.27 patients. Statistics were performed with a two-sided Fisher’s exact test (ns— not significant). Source data are provided as a Source Data file.

