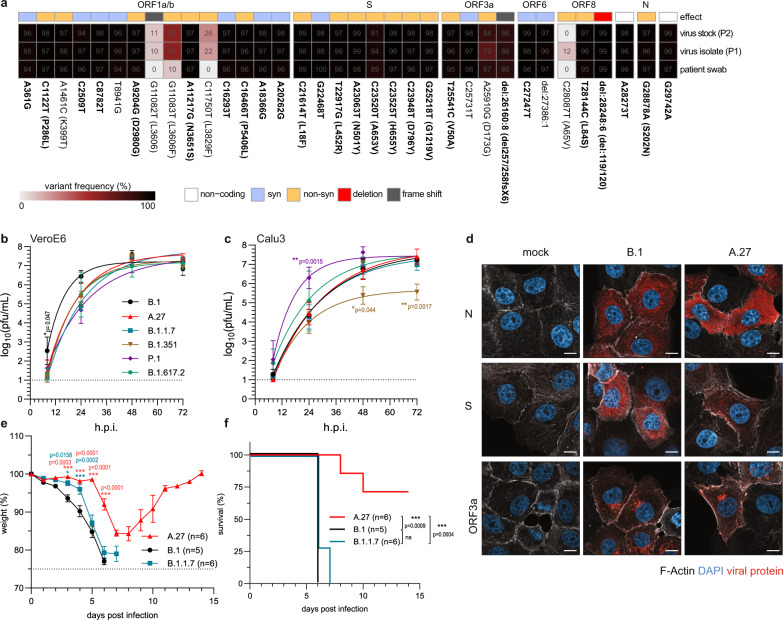
Fig. 5. A.27 Black Forest isolate displays all lineage-defining mutations and is attenuated in vivo.
a Variant frequency plot (https://github.com/jonas-fuchs/SARS-CoV-2-analyses) of the variant frequencies detected by next-generation sequencing in the oropharyngeal swab of a patient from the Black Forest area in Germany infected with A.27, after virus isolation (passage 1/P1) and virus cultivation (passage 2/P2) on VeroE6 cells. The variant frequencies in comparison to Wuhan-Hu-1 (NC_045512.2) are plotted as a heatmap with the respective frequencies indicated as %. Mutations present in 75% of A.27 sequences are marked bold. b, c Viral growth kinetics of the A.27/Freiburg isolate (P2) in comparison to the virus isolates B.1, B.1.1.7, B.1.351, P.1 and B.1.617.2 in (b) VeroE6 or (c) Calu3 cells. Confluent cells were infected (moi of 0.001) and the cell supernatant was harvested after 8, 24, 48 and 72 h post infection. Viral titres were determined by plaque assay on VeroE6 cells. The log-transformed titres are shown as means ± SD from three independent experiments. Significance was determined in comparison to A.27 via a two-way ANOVA with a Tukey´s multiple comparison test, *p < 0.05, **p < 0.01. d Confocal fluorescence microscopy analysis of B.1 or A.27 infected VeroE6 cells (moi 0.1) 8 h post infection. Fixed cells were stained with SARS-CoV-2 N, S and ORF3a specific antibodies (red). In addition, F-actin (phalloidin, white) and nuclear DNA (DAPI, blue) were detected. Shown are representative pictures of two independent experiments. Scale bars indicate 10 µm. e, f Weight loss (e) and survival (f) of hACE2 transgenic mice infected intranasally with 132 pfu of the A.27 (n = 7), B.1 (n = 5) or B.1.1.7 (n = 7) isolates were monitored daily (mean ± SEM). Significance in weight loss was determined in comparison to B.1 via a two-way ANOVA with a Tukey´s multiple comparison test, *p < 0.05, ***p < 0.001. Significance for the survival was calculated with a Log-rank (Mantel–Cox) test (ns—not significant, ***p < 0.001). Source data are provided as a Source Data file.

