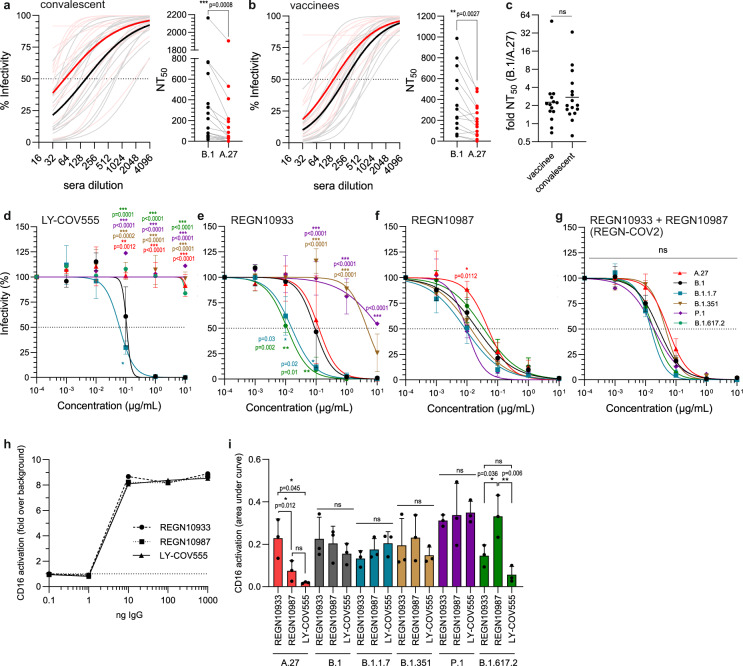
Fig. 6. Neutralizing capacity of sera and therapeutic monoclonal antibodies against A.27.
a Neutralizing activity of convalescent sera (n = 16) or (b) sera from BioNTech BNT162b2 vaccinees (n = 14) against B.1 (gray) or A.27 (red). 100 pfu of each virus was incubated with serial twofold sera dilutions and analyzed by plaque assay. The curve fits (light color) and the mean curve fit (dark color) were plotted (left panel) and neutralization titres calculated (right panel). Statistics were performed with a paired, two-tailed t-test (**p < 0.01, ***p < 0.001). c The fold difference of the NT50 between B.1 and A.27 was calculated for the analyzed convalescent sera (n = 16) and sera from vaccinees (n = 14). Shown are the individual values and the geometric mean. Statistics were performed on log2-transformed values with a two-tailed t-test (ns—not significant). d–g Neutralizing capacity of the therapeutic antibodies (d) LY-COV555, (e) REGN10933, (f) REGN10987 or (g) the combination of REGN10933 and REGN10987 in a 1:1 ratio. Serial tenfold dilutions of the monoclonal antibodies were incubated with 100 pfu of the different viruses and analyzed by plaque assay. Plotted are the curve fits and mean ± SD of three independent experiments. Statistics were calculated with a two-way ANOVA (Tukey’s multiple comparison test, *p < 0.05, **p < 0.01, ***p < 0.001). h, i CD16 reporter cell IL-2 production was quantified via anti-mIL-2 ELISA. REGN10987, REGN10933 or LY-COV555 were (h) titrated and immobilized or (i) inactivated virions of different SARS-CoV-2 isolates were titrated, immobilized and opsonized with 20 ng/µl of IgG. In (e) the mean of two independent experiments is displayed. The dotted horizontal line in (h) represents the ELISA background set to 1. For (i) the area under the curve was calculated from virion titration (undiluted, 1:10,1:100). Shown are mean and standard deviation of three independent experiments. Statistics were performed with a one-way ANOVA (Tukey’s multiple comparison test, ns—not significant, *p < 0.05, **p < 0.01). Source data are provided as a Source Data file.

