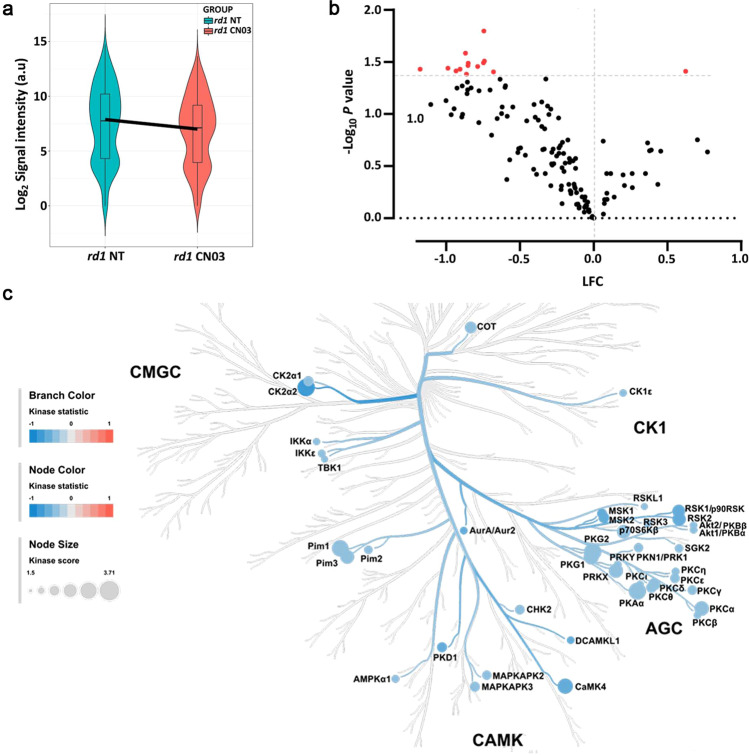
Fig. 3. Serine/Threonine Kinase (STK) activity in response to PKG inhibition in retinal explants.
Retinal explant cultures were either non-treated (NT) or treated with 50 µM CN03 (rd1 NT, n = 8; rd1 CN03, n = 10). The kinase activity of retinal explant lysates was measured on PamChip® Serine/Threonine kinase (STK) arrays. a Violin plot showing the global phosphorylation of peptides on the PamChip® STK array as Log2 signal intensity and their intensity value distribution, when comparing rd1 NT to rd1 CN03 treated explants. The thick line is connecting the average values of each group. b Volcano plot representing Log Fold Change (LFC) and -Log10 p value for peptide phosphorylation. Red dots indicate significantly changed phosphopeptides with p value < 0.05 and black dots represent phosphopeptides with no significant alteration in phosphorylation. c The high-ranking kinases are visualized in a kinome phylogenetic tree, where branch and node color are encoded according to the kinase statistic, with values < 0 (in blue) representing lower kinase activity in rd1 retinal explants treated with CN03. The node size is encoded by the kinase score, that ranks kinases based on their significance and specificity in terms of sets of peptides used for the corresponding kinase.

