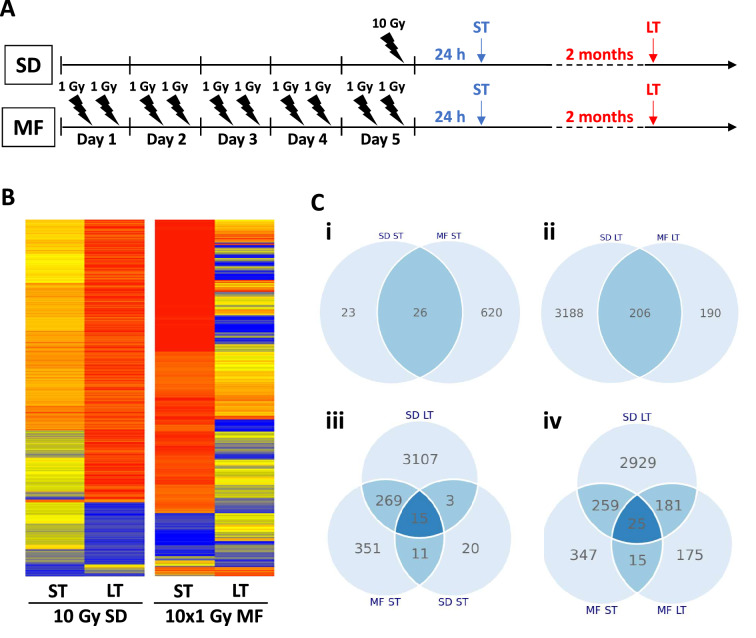
Figure 1.
Gene expression after irradiation is fractionation- and time-dependent. (A) Treatment schedule for single dose (SD) and multifractionated (MF) irradiation. MF irradiation was performed with 2 fractions of 1 Gy per day to a total dose of 10 Gy. (B). Heat map of gene expression which was analyzed at 24 h (short term, ST) or 2 months (long term, LT) after the final irradiation dose. Relative gene expression was normalized to the unirradiated control. (C) Venn diagrams showing the number of overlapping or distinct significantly altered genes (fold change ≤ 0.66 or fold change ≥ 1.5, P < 0.05) under the different treatment conditions compared to the unirradiated controls.

