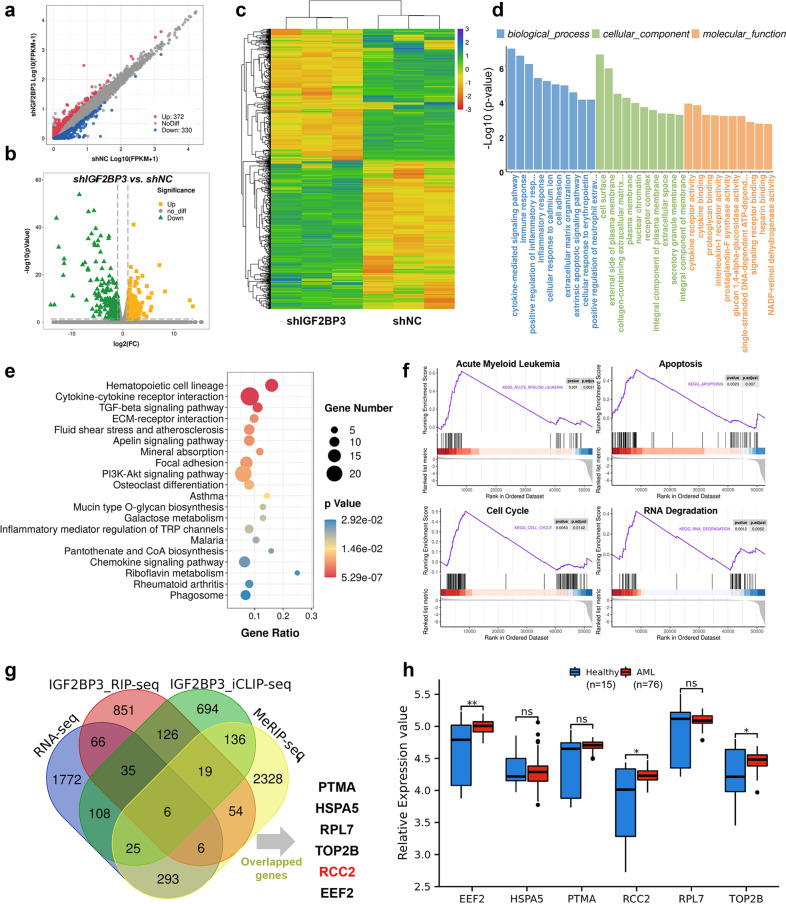
Fig. 5. Identification of the potential IGF2BP3 targets in AML.
a Scatter plot of differentially expressed genes. The values on the X and Y axes in the scatter plot are the average FPKM values of each group (log10 scale). The dots above the top line (372 red dots, upregulated in the shIGF2BP3 group) or below the bottom line (330 blue dots, upregulated in the shNC group) indicate genes with a change in expression of more than 2-fold between the two comparison groups. b Volcano plot of differentially expressed genes. The values on the X and Y axes in the volcano plot are the fold change (log2 transformed) values and P values (−log10 transformed) between the two groups, respectively. The green/yellow dots indicate differentially expressed genes with a statistically significant change in expression of greater than 2-fold. c Heatmap generated from the RNA-seq data showing the representative genes after IGF2BP3 knockdown. d, e Gene Ontology (GO) and Kyoto Encyclopedia of Genes and Genomes (KEGG) analyses revealed the potential roles of differentially expressed genes following IGF2BP3 knockdown in HL-60 cells. f Representative GSEA results showed that apoptosis, the cell cycle, and RNA degradation were closely correlated with IGF2BP3 expression. g Venn diagram showing that 6 candidate genes—PTMA, HSPA5, RPL7, TOP2B, RCC2, and EEF2—overlapped with the predicted direct targets of IGF2BP3. h The expression differences in candidate genes were analyzed from GSE12662, and EEF2, RCC2, and TOP2B were verified to be highly expressed. *P < 0.05; **P < 0.01; ***P < 0.001.

