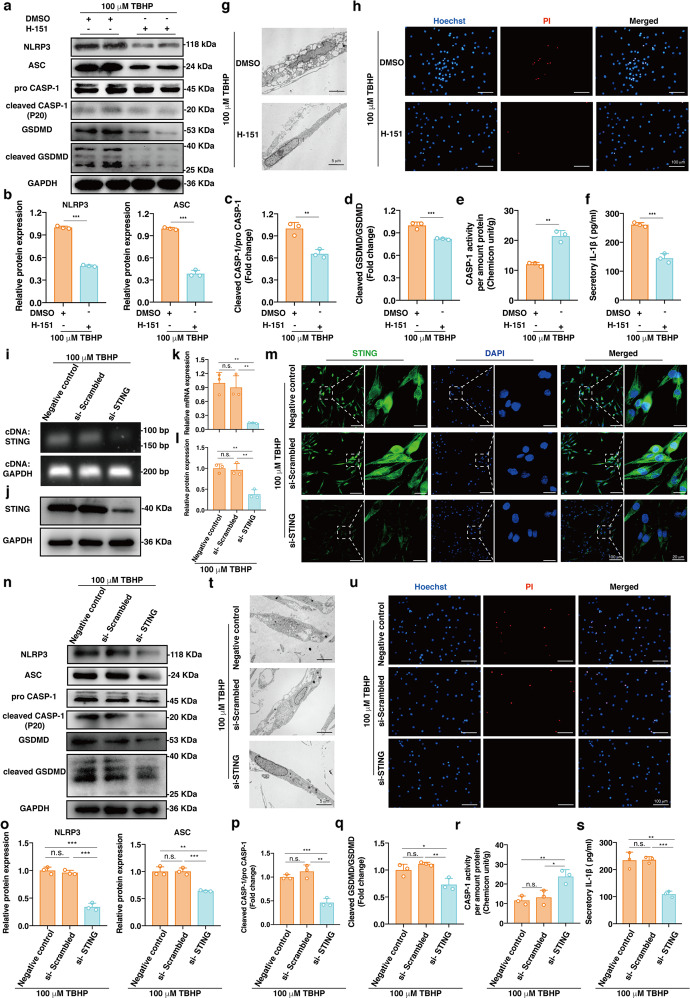
Fig. 3. Inhibiting STING activation alleviated NP cell pyroptosis under oxidative stress.
A selective small molecule STING antagonist (H-151, 1 μM) or DMSO in combination with 100 μM TBHP was used to treat NP cells for 24 h. a Representative western blotting images of NLRP3, ASC, pro-CASP-1, cleaved CASP-1, GSDMD, and cleaved GSDMD in the H-151- or DMSO-treated NP cells. b Quantification of the protein levels of NLRP3 and ASC in the H-151-treated NP cells compared to the vehicle control-treated cells. c The ratio of cleaved CASP-1 to pro-CASP-1 in the H-151-treated NP cells compared to the vehicle control-treated cells. d The ratio of cleaved GSDMD to GSDMD in the H-151-treated NP cells compared to the vehicle control-treated cells. e The enzymatic activity of CASP-1 in the H-151- or DMSO-treated NP cells normalized to the total protein amount. f The quantitative level of IL-1β in cell culture supernatants in the H-151- or DMSO-treated NP cells. g TEM images of the H-151 or DMSO-treated NP cells. h Representative fluorescence images of Hoechst/PI staining in the H-151- or DMSO-treated NP cells. NP cells were transfected with STING siRNA and treated with 100 μM TBHP. i Representative STING cDNA agar gelatin electrophoresis image in the negative control, si-Scrambled, and si-STING groups. j Representative western blotting images of STING after siRNA knockdown. k RT-qPCR quantitative analysis of STING mRNA after siRNA knockdown. l Quantification of the protein level of STING after siRNA knockdown. m Representative immunofluorescence images of STING with different degrees of polymerization after siRNA knockdown. n Representative western blotting analysis of NLRP3, ASC, pro-CASP-1, cleaved CASP-1, GSDMD, and cleaved GSDMD after siRNA knockdown. o Quantification of the protein expression levels of NLRP3 and ASC after siRNA knockdown. p The ratio of cleaved CASP-1 to pro-CASP-1 after siRNA knockdown. q The ratio of cleaved GSDMD to GSDMD after siRNA knockdown. r The enzymatic activity of CASP-1 after siRNA knockdown normalized to the total protein amount. s The quantitative level of IL-1β in cell culture supernatants after siRNA knockdown. t TEM images of NP cells after siRNA knockdown. u Representative fluorescence images of Hoechst/PI staining after siRNA knockdown. Data are shown as the mean ± SD of at least three independent experiments. Statistical analyses were conducted using two-way ANOVA and Student’s t test. The P value is indicated by stars: n.s. no significance, *P < 0.05, **P < 0.01, ***P < 0.001.

