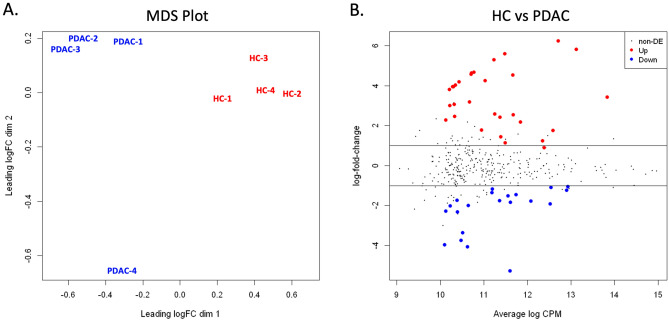
Figure 3.
Statistical comparison of proteins identified in EVs isolated from healthy control (HC) and PDAC pancreatic organoids. (A) Multidimensional scaling (MDS) demonstrates clustering of samples by condition (HC versus PDAC) with PDAC-4 further removed from other PDAC samples. (B) Distribution of the candidate proteins with significant change (Up or Down) or without differential expression (non-DE) between the HC and PDAC sample sets are visualized by plotting fold change vs CPM.

