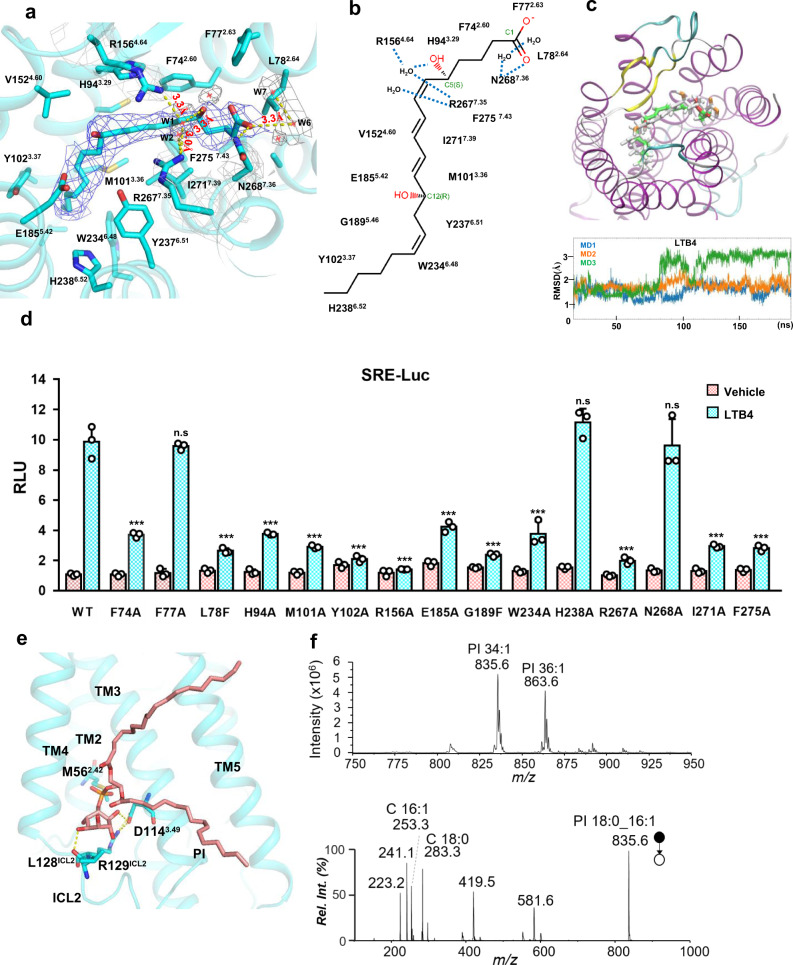
Fig. 2. Ligand binding pocket of BLT1.
a BLT1 ligand binding pocket for LTB4. The LTB4 molecule is shown in magenta in the middle of the pocket, density map of LTB4 (blue mesh) is set at contour level of 5.0, density map of water (grey mesh) is set at contour level of 4.0, density map of R1564.64 and R2677.35 is set at contour level of 4.0. Surrounding residues within 5.0 Å of LTB4 are shown in sticks and colored in cyan. b The scheme of the chemical structure of LTB4 and surround residues. c A representative snapshot of MD simulation. LTB colored in white is the original pose in the cryo-EM structure, LTB colored in green is the representative pose of the MD simulation. Lower panel, RMSD of the LTB4 trajectories in the simulations. d A SRE reporter assay of key mutants in the ligand-binding pocket. LTB4, 300 nM; data are presented as mean values ± SD; n = 3 independent samples; n.s. no significant; *p < 0.05; **p < 0.01; ***p < 0.001. The exact p value for F74A, F77A, L78A, H94A, M101A, Y102A, R156A, E185A, G189F, W234A, H238A, R267A, N268A, I271A, F275A are: 0.0005, 0.66, 0.0003, 0.0005, 0.0003, 0.0002, 0.0001, 0.0009, 0.0002, 0.001, 0.19, 0.0002, 0.84, 0.0003, 0.0003, respectively. T-test, two tailed, sample equal variance. RLU, relative luciferase unit. WT, wild-type. e Detail of the PI binding pocket. f Mass spectrometry analysis of lipid component of the BLT1/Gi complex.

