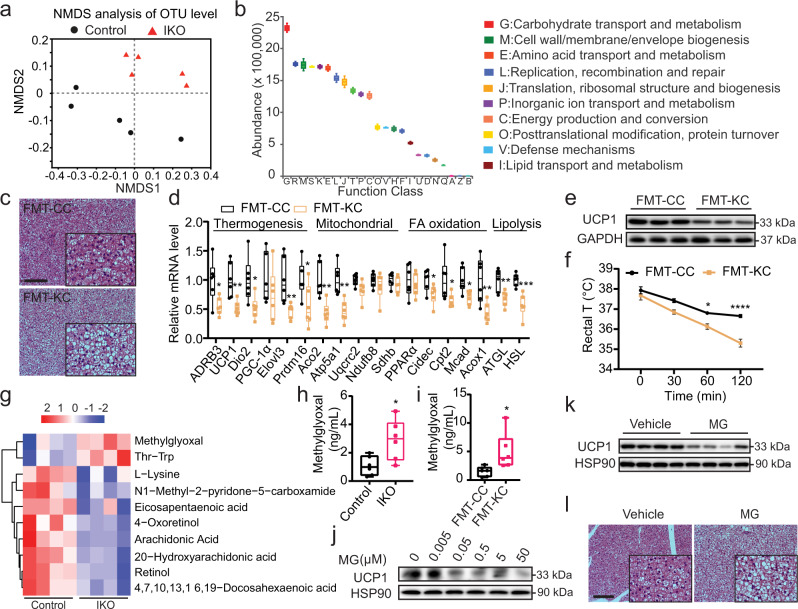
Fig. 2. Intestinal AMPK remotely regulates BAT function by modulating gut microbiota and their metabolites.
a Non-metric multidimensional scaling (NMDS) analysis of operational taxonomic unit (OTU) levels in AMPKα1fl/fl (Control) and AMPKα1-IKO mice fed chow diet (n = 5 biologically independent samples). b Functional classification of microbiota with differential abundance in AMPKα1-IKO mice compared to AMPKα1fl/fl mice, based on the Clusters of Orthologous Groups (COGs) database (n = 5 biologically independent samples). c Representative images of H&E-stained BAT sections from FMT recipient mice. Scale bar = 100 µm. FMT-CC, FMT from AMPKα1fl/fl mice to WT mice; FMT-KC, FMT from AMPKα1-IKO mice to WT mice. d Relative mRNA levels of genes expressed in the BAT of recipient mice (n = 6 biologically independent samples). P value: 0.0171, 0.0041, 0.0203, 0.0097, 0.0380, 0.0025, 0.0018, 0.0357, 0.0371, 0.0121, 0.0080, 0.0080, 0.0007. e Representative Western blot analysis of UCP1 protein levels in the BAT of recipient mice. f Rectal temperatures of recipient mice exposed to 6 °C for 2 h (n = 6 biologically independent samples for FMT-CC group and n = 8 biologically independent samples for FMT-KC group). P value: 0.0152, <0.0001. g Metabolomic analysis of serum samples from DIO Control and AMPKα1-IKO mice. h, i Serum methylglyoxal levels in DIO mice (h) and FMT recipient mice (i), measured using ELISA (n = 6 biologically independent samples). P value for h: 0.0172, P value for i: 0.0266. j Representative Western blot analysis of UCP1 protein expression in HIB1B cells treated with methylglyoxal (MG) for 24 h. k UCP1 protein expression in the BAT of WT mice after intraperitoneally (i.p.) with methylglyoxal (50 mg/kg) once daily for 14 days. l Representative images of H&E-stained BAT sections of mice treated with methylglyoxal. Scale bar = 100 µm. Values are means ± s.e.m. for b, f. The boxplot elements (for d, h, i) are defined as following: center line, median; box limits, upper and lower quartiles; whiskers, 1.5 × interquartile range. *P < 0.05, **P < 0.01, ***P < 0.001 and ****P < 0.0001 by two-tailed Student’s t-tests for d, h, j and two-way ANOVA with Tukey’s post-hoc tests for (f). Source data are provided as a Source Data file.

