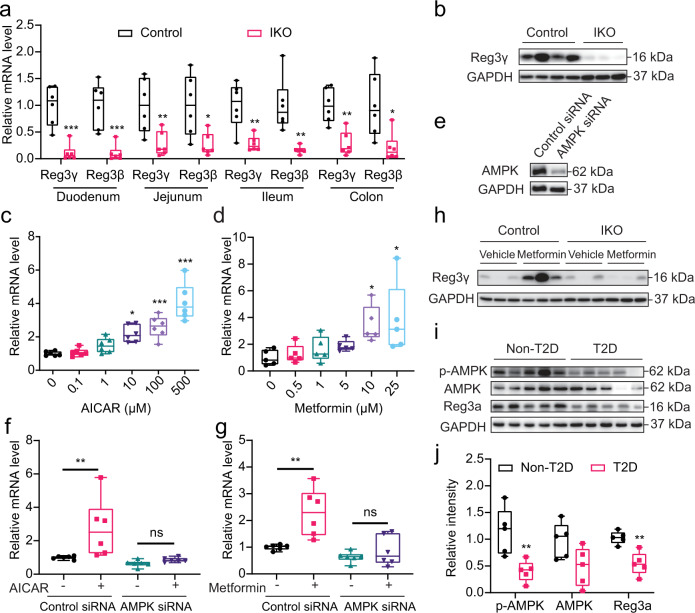
Fig. 3. Intestinal AMPKα1 regulates the AMP Reg3.
a Relative mRNA levels of Reg3γ and Reg3β in the duodenum, jejunum, ileum, and colon of AMPKα1fl/fl (Control) and AMPKα1-IKO mice fed chow diet (n = 6 biologically independent samples). P value: 0.0003, 0.0007, 0.0095, 0.0143, 0.0029, 0.0022, 0.0011, 0.0143. b Representative Reg3γ protein levels in the jejunum of mice fed chow diet. c, d Relative mRNA levels of Reg3α in HT-29 cells treated with gradient concentrations of AICAR (c, n = 6 biologically independent samples, P value: 0.0078, 0.0004, <0.0001) and metformin (d, n = 5 biologically independent samples, P value: 0.0315, 0.0120). e Western blot analysis of AMPK protein in HT-29 cells treated with control siRNA or AMPK siRNA. f, g Relative mRNA levels of Reg3α in AMPK knockdown HT-29 cells treated with 100 µM of AICAR (f) or 10 µM of metformin (g) for 24 h. n = 6 biologically independent samples. P value for f: 0.0128. P value for g: 0.0023. h Representative Reg3γ protein levels in WT DIO mice treated with metformin. i Western blot analysis of total AMPK, phosphorylated AMPK (p-AMPK), and Reg3α in duodenal mucosa samples from patients with obesity and T2D. j The quantitated densities of these Western blot bands are also shown (n = 5 biologically independent samples). P value: 0.0089, 0.0023. The boxplot elements (for a, c, d, f, g, j) are defined as following: center line, median; box limits, upper and lower quartiles; whiskers, 1.5 × interquartile range. *P < 0.05, **P < 0.01, ***P < 0.001 and ****P < 0.0001 by two-tailed Student’s t-test (for a, cf. Control mice; for j, cf. non-T2D human samples), and one- or two-way ANOVA with Tukey’s post-hoc tests (for c, d, cf. vehicle-treated cells; for f, g, cf. vehicle-treated cells infected with control siRNA). Source data are provided as a Source Data file.

