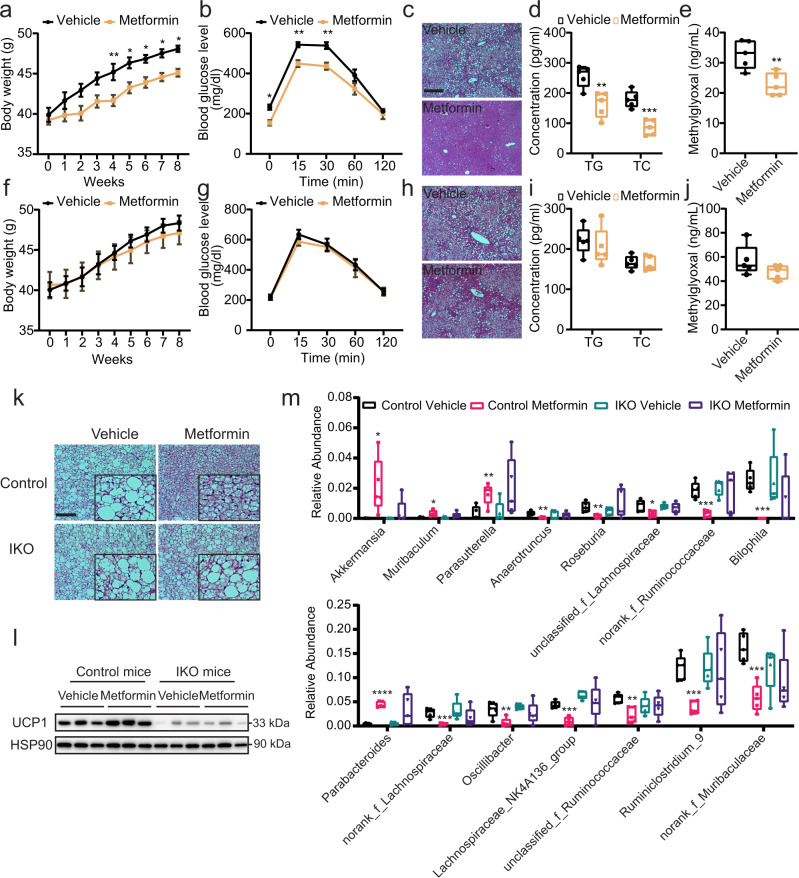
Fig. 4. The therapeutic effects of metformin on metabolic disorders depend on intestinal AMPK.
DIO AMPKα1fl/fl (Control; a–d) and AMPKα1-IKO (e–h) mice were orally garaged with metformin (100 mg/kg) once daily for 8 weeks. a, f Body weights of mice during metformin treatment (n = 7 biologically independent samples). P value for a: 0.0066, 0.0264, 0.0417, 0.0400, 0.0384. b, g Glucose tolerance test results at 8 weeks of metformin administration (n = 7 biologically independent samples). P value for b: 0.0308, 0.0055, 0.0022. c, h Representative images of H&E-stained liver sections. Scale bar = 100 µm. d, i Fasting serum levels of triglycerides (TG) and total cholesterol (TC) (n = 5 biologically independent samples). P value for d: 0.0054, 0.0006. e, j Serum methylglyoxal levels measured by LC/MS–MS methods (n = 5 biologically independent samples). P value for e: 0.0061. k Representative images of H&E-stained BAT sections, Scale bar = 100 µm. l Representative UCP1 protein expression in BAT. m Relative abundance of microbiota at the genus level (n = 5 biologically independent samples). P value for the upper panel: 0.0313, 0.0173, 0.0081, 0.0016, 0.0049, 0.0193, 0.0004, 0.0001. P value for the lower panel: <0.0001, 0.0007, 0.0091, 0.0001, 0.0032, 0.0002, 0.0005. Values are means ± s.e.m. for a, b and f, g. The boxplot elements are defined as following: center line, median; box limits, upper and lower quartiles; whiskers, 1.5 × interquartile range for d, e, i, j, and m. *P < 0.05, **P < 0.01, ***P < 0.001 and ****P < 0.0001 cf. vehicle-treated mice by two-tailed Student’s t-test (for d, e, i, j, m), and two-way ANOVA with Tukey’s post-hoc tests (for a, b, f, g). Source data are provided as a Source Data file.

