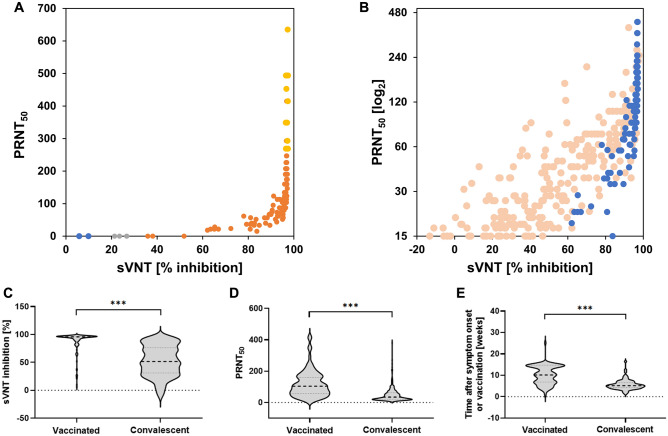
Figure 3.
Performance of the sVNT ELISA in fully vaccinated individuals in comparison to convalescent patients. (A) Comparison of PRNT50 and binding inhibition in vaccinated individuals (N = 112). Data points are color-coded according to the GenScript sVNT results and in-house cutoffs: blue (< 15% = negative), gray (≥ 15 to < 35% = equivocal) and orange (≥ 35% = positive). Samples with titers above the PRNT quantification limit ( >) are marked in yellow. (B) Comparison between sVNT and PRNT (PRNT50) in vaccinated (blue; N = 90) versus convalescent (light orange; N = 242; data from Fig. 1C) individuals, including only PRNT-positive samples. (C) Distribution of the sVNT-binding inhibition results in vaccinated (N = 112) and convalescent individuals (N = 242). (D) Distribution of PRNT50 titers in vaccinated (N = 90) and convalescent (N = 242) individuals. (E) Time difference between symptom onset or vaccination (N = 90) and convalescent (N = 75) individuals for whom the period between symptom onset or vaccination and sampling was known. Statistics: t-test, ***p ≤ 0.001.

