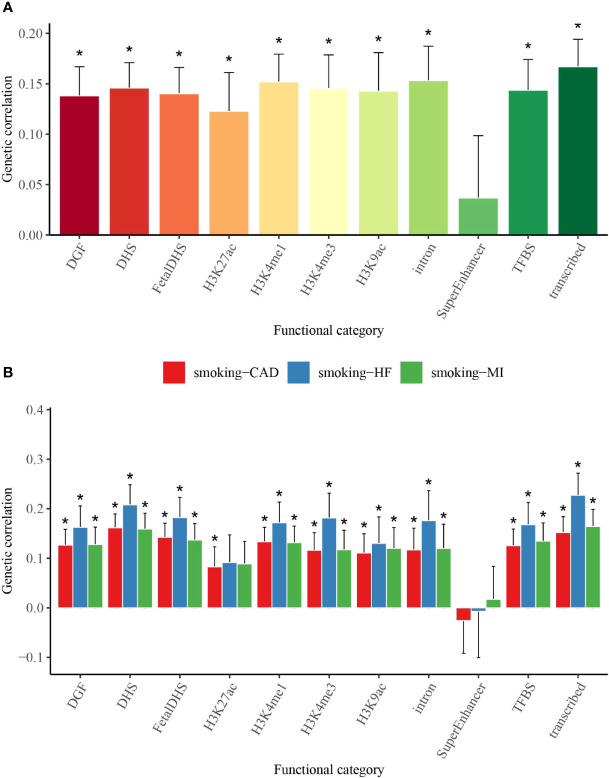
Figure 2.
Partitioned genetic correlations of smoking status and T2D, CAD, MI, and HF. (A) Partitioned genetic correlations of smoking status and T2D. (B) Partitioned genetic correlations of smoking status and CAD, MI, and HF. The vertical axis represents the genetic correlation estimate; the horizontal axis represents 11 functional categories. The asterisk represents significance after Benjamini–Hochberg correction (FDR < 0.05); error bars represent the SE of the genetic correlation estimate. T2D, type 2 diabetes; CAD, coronary artery disease; MI, myocardial infarction; HF, heart failure; FDR, false discovery rate.

