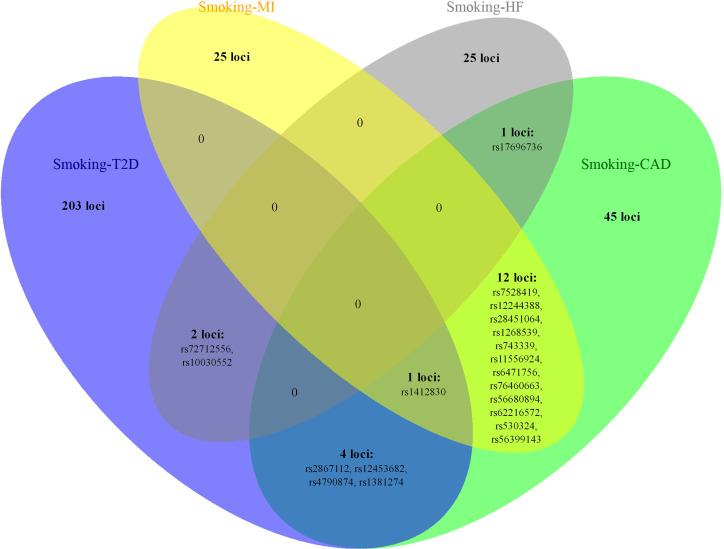
Figure 3.
The overlapping loci at the SNP level identified by the cross-trait meta-analysis across different trait pairs. The Venn diagram illustrates the overlapping loci at the SNP level identified by the cross-trait meta-analysis across different trait pairs. T2D, type 2 diabetes; CAD, coronary artery disease; MI, myocardial infarction; HF, heart failure; SNP, single-nucleotide polymorphism.

