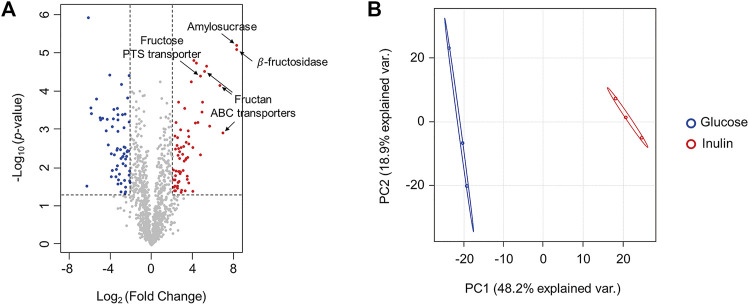
FIGURE 3.
Comparison of proteomic changes of F. prausnitzii grown in mYCFA supplemented with glucose or inulin. (A) Volcano plot for proteomic changes of F. prausnitzii grown in mYCFA supplemented with glucose or inulin. Volcano plots indicate the upregulated proteins of inulin-grown F. prausnitzii in red circles and downregulated proteins in blue circles. Indications are proteins discussed in this study. (B) Principal component analysis (PCA) plot of proteomic analysis for F. prausnitzii grown in each carbon source. Proteomic analysis was performed in triplicates.

